
Local Jobs and Payroll in Wyoming: Construction Sector Adds Jobs in 2012Q1 (Tables and Figures)
See Related Article
Tables 1, 2, 3, 4, 5*, 6*
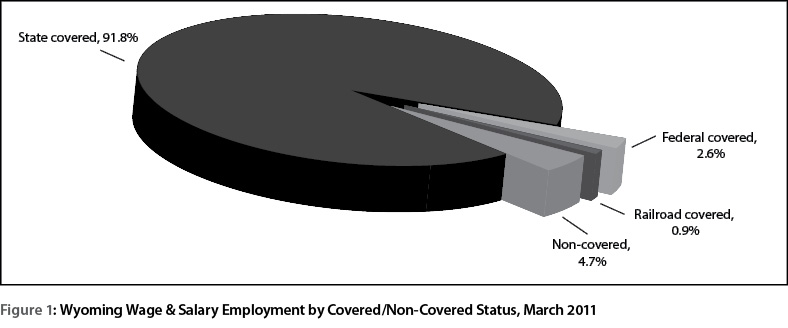
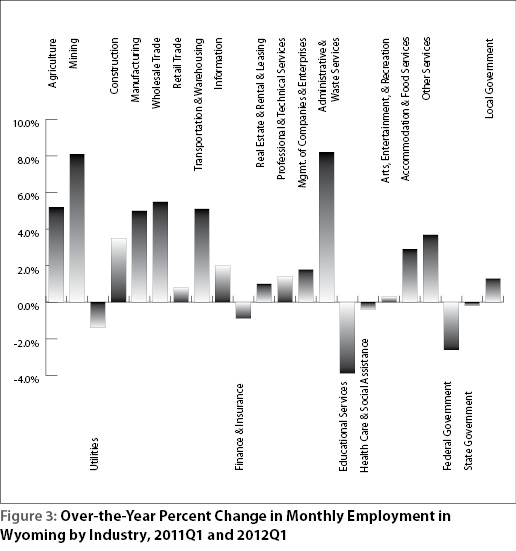
Figures 1, 2, 3
*Due to space considerations, Table 5 (Natrona County) and Table 6 (Laramie County) do not appear in the printed version of Trends.
| Average Monthly Employment Percentage Change Over the Previous |
Total Wages Percentage Change Over the Previous |
Average Weekly Wage Percentage Change Over the Previous |
||||
|---|---|---|---|---|---|---|
| Year | Quarter | Year | Quarter | Year | Quarter | |
| 2008Q1 | 3.6 | -1.7 | 10.6 | -6.0 | 6.8 | -4.4 |
| 2009Q1 | -1.0 | -4.9 | -1.2 | -13.0 | -0.2 | -8.5 |
| 2010Q1 | -4.7 | -3.2 | -4.9 | -9.8 | -0.3 | -6.7 |
| 2011Q1 | 1.1 | -3.3 | 5.4 | -10.3 | 4.3 | -7.3 |
| 2012Q1a | 2.5 | -2.9 | 7.8 | -5.7 | 5.2 | -2.9 |
| Five-Year Average for Q1 | 0.3 | -3.2 | 3.5 | -8.9 | 3.1 | -6.0 |
| aPreliminary | ||||||
| Source: Quarterly Census of Employment and Wages, developed through a cooperative program between Research & Planning and the U.S. Bureau of Labor Statistics. | ||||||
| Extract date: July 2012. | ||||||
| Average Monthly Employment |
Total Wages | |
|---|---|---|
| 2004Q1 | 3.0 | 7.2 |
| 2004Q2 | 2.9 | 7.1 |
| 2004Q3 | 2.0 | 7.1 |
| 2004Q4 | 2.4 | 6.5 |
| 2005Q1 | 1.9 | 6.6 |
| 2005Q2 | 2.1 | 8.3 |
| 2005Q3 | 2.7 | 11.7 |
| 2005Q4 | 3.4 | 10.1 |
| 2006Q1 | 5.1 | 15.1 |
| 2006Q2 | 5.0 | 15.5 |
| 2006Q3 | 4.6 | 14.8 |
| 2006Q4 | 5.1 | 17.1 |
| 2007Q1 | 4.8 | 14.5 |
| 2007Q2 | 3.9 | 12.4 |
| 2007Q3 | 3.7 | 8.0 |
| 2007Q4 | 3.8 | 11.3 |
| 2008Q1 | 3.6 | 10.6 |
| 2008Q2 | 3.1 | 8.7 |
| 2008Q3 | 3.4 | 10.1 |
| 2008Q4 | 2.4 | 6.8 |
| 2009Q1 | -1.0 | -1.2 |
| 2009Q2 | -3.4 | -5.0 |
| 2009Q3 | -5.3 | -8.4 |
| 2009Q4 | -6.3 | -8.4 |
| 2010Q1 | -4.7 | -4.9 |
| 2010Q2 | -1.7 | 1.1 |
| 2010Q3 | 0.0 | 4.8 |
| 2010Q4 | 1.1 | 6.0 |
| 2011Q1 | 1.1 | 5.4 |
| 2011Q2 | 0.8 | 4.7 |
| 2011Q3 | 1.4 | 6.5 |
| 2011Q4 | 2.0 | 2.5 |
| 2012Q1a | 2.5 | 7.8 |
| aPreliminary. | ||
| Source: Quarterly Census of Employment and Wages, developed through a cooperative program between Research & Planning and the U.S. Bureau of Labor Statistics. | ||
| Extract date: July 2012. | ||
| County | Average Monthly Employment | Total Payroll | Average Weekly Wage | |||||||||
|---|---|---|---|---|---|---|---|---|---|---|---|---|
| First Quarter | Change | First Quarter | Change | First Quarter | Change | |||||||
| 2011 | 2012 | n | % | 2011 | 2012 | $ | % | 2011 | 2012 | $ | % | |
| Total | 263,558 | 270,028 | 6,470 | 2.5 | $2,769,072,169 | $2,984,899,676 | $215,827,507 | 7.8 | $808 | $850 | $42 | 5.2 |
| Albany | 15,019 | 15,127 | 108 | 0.7 | $131,904,182 | $134,664,982 | $2,760,800 | 2.1 | $676 | $685 | $9 | 1.3 |
| Big Horn | 3,949 | 4,047 | 98 | 2.5 | 33,229,456 | 36,032,733 | 2,803,277 | 8.4 | 647 | 685 | 38 | 5.9 |
| Campbell | 27,109 | 27,762 | 653 | 2.4 | 378,377,090 | 397,736,585 | 19,359,495 | 5.1 | 1,074 | 1,102 | 28 | 2.6 |
| Carbon | 6,457 | 6,481 | 24 | 0.4 | 62,550,066 | 65,328,727 | 2,778,661 | 4.4 | 745 | 775 | 30 | 4.0 |
| Converse | 5,299 | 5,700 | 401 | 7.6 | 55,851,391 | 61,379,768 | 5,528,377 | 9.9 | 811 | 828 | 17 | 2.1 |
| Crook | 2,198 | 2,239 | 41 | 1.9 | 18,343,606 | 19,525,875 | 1,182,269 | 6.4 | 642 | 671 | 29 | 4.5 |
| Fremont | 16,104 | 16,380 | 276 | 1.7 | 148,179,541 | 158,610,774 | 10,431,233 | 7.0 | 708 | 745 | 37 | 5.2 |
| Goshen | 4,485 | 4,551 | 66 | 1.5 | 33,592,332 | 36,046,991 | 2,454,659 | 7.3 | 576 | 609 | 33 | 5.7 |
| Hot Springs | 2,085 | 2,090 | 5 | 0.2 | 16,227,033 | 16,897,229 | 670,196 | 4.1 | 599 | 622 | 23 | 3.8 |
| Johnson | 3,061 | 3,100 | 39 | 1.3 | 22,778,357 | 24,663,863 | 1,885,506 | 8.3 | 572 | 612 | 40 | 7.0 |
| Laramie | 41,872 | 42,715 | 843 | 2.0 | 400,300,499 | 439,104,413 | 38,803,914 | 9.7 | 735 | 791 | 56 | 7.6 |
| Lincoln | 5,832 | 5,631 | -201 | -3.4 | 61,362,020 | 56,781,924 | -4,580,096 | -7.5 | 809 | 776 | -33 | -4.1 |
| Natrona | 37,704 | 39,753 | 2,049 | 5.4 | 412,904,007 | 466,237,678 | 53,333,671 | 12.9 | 842 | 902 | 60 | 7.1 |
| Niobrara | 850 | 892 | 42 | 4.9 | 6,322,315 | 6,708,978 | 386,663 | 6.1 | 572 | 579 | 7 | 1.2 |
| Park | 12,144 | 12,599 | 455 | 3.7 | 110,330,422 | 121,426,744 | 11,096,322 | 10.1 | 699 | 741 | 42 | 6.0 |
| Platte | 3,463 | 3,386 | -77 | -2.2 | 31,186,552 | 31,885,325 | 698,773 | 2.2 | 693 | 724 | 31 | 4.5 |
| Sheridan | 12,335 | 12,465 | 130 | 1.1 | 109,171,900 | 115,037,236 | 5,865,336 | 5.4 | 681 | 710 | 29 | 4.3 |
| Sublette | 5,346 | 5,811 | 465 | 8.7 | 82,109,302 | 90,269,895 | 8,160,593 | 9.9 | 1,181 | 1,195 | 14 | 1.2 |
| Sweetwater | 23,695 | 24,388 | 693 | 2.9 | 312,149,268 | 347,514,150 | 35,364,882 | 11.3 | 1,013 | 1,096 | 83 | 8.2 |
| Teton | 15,764 | 16,168 | 404 | 2.6 | 153,703,862 | 156,607,338 | 2,903,476 | 1.9 | 750 | 745 | -5 | -0.7 |
| Uinta | 8,733 | 9,022 | 289 | 3.3 | 87,884,942 | 94,791,136 | 6,906,194 | 7.9 | 774 | 808 | 34 | 4.4 |
| Washakie | 3,801 | 3,709 | -92 | -2.4 | 32,943,728 | 33,919,138 | 975,410 | 3.0 | 667 | 703 | 36 | 5.4 |
| Weston | 2,206 | 2,190 | -16 | -0.7 | 18,038,746 | 19,438,789 | 1,400,043 | 7.8 | 629 | 683 | 54 | 8.6 |
| Nonclassifiedb | 4,049 | 3,824 | -224 | -5.5 | 49,631,552 | 54,289,405 | 4,657,853 | 9.4 | 943 | 1,092 | 149 | 15.8 |
| aPreliminary. | ||||||||||||
| b The employer may be located statewide or in more than one county. | ||||||||||||
| Source: Quarterly Census of Employment and Wages, developed through a cooperative program between Research & Planning and the U.S. Bureau of Labor Statistics. | ||||||||||||
| Extract date: July 2012. | ||||||||||||
| NAICSb Title | Average Monthly Employment | Total Payroll | Average Weekly Wage | |||||||||
|---|---|---|---|---|---|---|---|---|---|---|---|---|
| First Quarter |
Change | First Quarter |
Change | First Quarter | Change | |||||||
| 2011 | 2012 | n | % | 2011 | 2012 | $ | % | 2011 | 2012 | $ | % | |
| Total, All Industries | 263,558 | 270,028 | 6,470 | 2.5 | $2,769,072,169 | $2,984,899,676 | $215,827,507 | 7.8 | $808 | $850 | $42 | 5.2 |
| Total Private | 197,232 | 203,313 | 6,081 | 3.1 | $2,062,027,863 | $2,244,917,273 | $182,889,410 | 8.9 | $804 | $849 | $45 | 5.6 |
| Agriculture | 2,130 | 2,241 | 111 | 5.2 | 14,763,574 | 16,528,200 | 1,764,626 | 12.0 | 533 | 567 | 34 | 6.4 |
| Mining | 26,182 | 28,311 | 2,129 | 8.1 | 540,591,285 | 613,243,965 | 72,652,680 | 13.4 | 1,588 | 1,666 | 78 | 4.9 |
| Utilities | 2,493 | 2,457 | -36 | -1.4 | 45,873,884 | 47,457,935 | 1,584,051 | 3.5 | 1,415 | 1,486 | 71 | 5.0 |
| Construction | 18,037 | 18,664 | 627 | 3.5 | 197,090,538 | 209,187,605 | 12,097,067 | 6.1 | 841 | 862 | 21 | 2.5 |
| Manufacturing | 8,701 | 9,136 | 435 | 5.0 | 115,744,551 | 128,048,619 | 12,304,068 | 10.6 | 1,023 | 1,078 | 55 | 5.4 |
| Wholesale Trade | 8,590 | 9,064 | 474 | 5.5 | 114,578,082 | 129,586,262 | 15,008,180 | 13.1 | 1,026 | 1,100 | 74 | 7.2 |
| Retail Trade | 28,096 | 28,309 | 213 | 0.8 | 177,517,284 | 185,422,557 | 7,905,273 | 4.5 | 486 | 504 | 18 | 3.7 |
| Transp. & Warehousing | 8,992 | 9,454 | 462 | 5.1 | 99,329,270 | 111,138,068 | 11,808,798 | 11.9 | 850 | 904 | 54 | 6.4 |
| Information | 3,822 | 3,899 | 77 | 2.0 | 37,249,186 | 40,241,345 | 2,992,159 | 8.0 | 750 | 794 | 44 | 5.9 |
| Finance & Insurance | 6,725 | 6,664 | -61 | -0.9 | 84,502,481 | 86,588,183 | 2,085,702 | 2.5 | 967 | 999 | 32 | 3.3 |
| Real Estate & Leasing | 3,876 | 3,915 | 39 | 1.0 | 38,010,007 | 40,838,060 | 2,828,053 | 7.4 | 754 | 802 | 48 | 6.4 |
| Prof. & Technical Svcs. | 9,024 | 9,153 | 129 | 1.4 | 113,316,246 | 119,895,906 | 6,579,660 | 5.8 | 966 | 1,008 | 42 | 4.3 |
| Mgmt. of Companies & Enterprises | 870 | 886 | 16 | 1.8 | 32,216,370 | 24,234,401 | -7,981,969 | -24.8 | 2,848 | 2,104 | -744 | -26.1 |
| Admin. & Waste Services | 6,567 | 7,103 | 536 | 8.2 | 46,042,525 | 54,268,913 | 8,226,388 | 17.9 | 539 | 588 | 49 | 9.1 |
| Educational Services | 1,645 | 1,581 | -64 | -3.9 | 10,828,061 | 11,562,497 | 734,436 | 6.8 | 506 | 563 | 57 | 11.3 |
| Health Care & Social Assistance | 23,617 | 23,511 | -106 | -0.4 | 211,090,091 | 220,481,313 | 9,391,222 | 4.4 | 688 | 721 | 33 | 4.8 |
| Ambulatory Health Care Services | 8,842 | 9,026 | 184 | 2.1 | 109,074,833 | 116,421,205 | 7,346,372 | 6.7 | 949 | 992 | 43 | 4.5 |
| Hospitals | 3,373 | 3,133 | -240 | -7.1 | 37,735,582 | 37,123,853 | -611,729 | -1.6 | 861 | 911 | 50 | 5.8 |
| Nursing & Residential Care Facilities | 4,537 | 4,617 | 80 | 1.8 | 30,680,304 | 32,383,233 | 1,702,929 | 5.6 | 520 | 540 | 20 | 3.8 |
| Social Assistance | 6,864 | 6,735 | -129 | -1.9 | 33,599,372 | 34,553,022 | 953,650 | 2.8 | 377 | 395 | 18 | 4.8 |
| Arts, Ent., & Recreation | 2,346 | 2,354 | 8 | 0.3 | 9,683,630 | 10,514,790 | 831,160 | 8.6 | 318 | 344 | 26 | 8.2 |
| Accomm. & Food Services | 27,590 | 28,395 | 805 | 2.9 | 109,761,480 | 124,702,487 | 14,941,007 | 13.6 | 306 | 338 | 32 | 10.5 |
| Other Services | 7,927 | 8,217 | 290 | 3.7 | 63,839,318 | 70,976,167 | 7,136,849 | 11.2 | 619 | 664 | 45 | 7.3 |
| Total Government | 66,327 | 66,715 | 388 | 0.6 | $707,044,306 | $739,982,403 | $32,938,097 | 4.7 | $820 | $853 | $33 | 4.0 |
| Federal Government | 7,212 | 7,025 | -187 | -2.6 | 98,387,438 | 105,375,795 | 6,988,357 | 7.1 | 1,049 | 1,154 | 105 | 10.0 |
| State Government | 13,278 | 13,250 | -28 | -0.2 | 169,511,804 | 172,399,431 | 2,887,627 | 1.7 | 982 | 1,001 | 19 | 1.9 |
| State Government Education | 3,587 | 3,551 | -36 | -1.0 | 44,691,141 | 44,216,262 | -474,879 | -1.1 | 958 | 958 | -1 | -0.1 |
| Local Government | 45,837 | 46,440 | 603 | 1.3 | 439,145,064 | 462,207,177 | 23,062,113 | 5.3 | 737 | 766 | 29 | 3.9 |
| Local Government Education | 24,542 | 24,703 | 161 | 0.7 | 230,326,817 | 238,387,823 | 8,061,006 | 3.5 | 722 | 742 | 20 | 2.8 |
| Hospitals | 6,515 | 6,727 | 213 | 3.3 | 74,976,952 | 86,474,425 | 11,497,473 | 15.3 | 885 | 989 | 103 | 11.7 |
| aPreliminary. | ||||||||||||
| bNorth American Industry Classification System. | ||||||||||||
| Source: Quarterly Census of Employment and Wages, developed through a cooperative program between Research & Planning and the U.S. Bureau of Labor Statistics. | ||||||||||||
| Extract date: July 2012. | ||||||||||||
| NAICSb Title | Average Monthly Employment | Total Payroll | Average Weekly Wage |
|||||||||
|---|---|---|---|---|---|---|---|---|---|---|---|---|
| First Quarter | Change | First Quarter | Change | First Quarter | Change | |||||||
| 2011 | 2012 | n | % | 2011 | 2012 | $ | % | 2011 | 2012 | $ | % | |
| Total, All Industries | 37,704 | 39,753 | 2,049 | 5.4 | $412,904,007 | $466,237,678 | $53,333,671 | 12.9 | $842 | $902 | $60 | 7.1 |
| Total Private | 31,967 | 34,005 | 2,038 | 6.4 | $346,243,394 | $397,762,293 | $51,518,899 | 14.9 | $833 | $900 | $67 | 8.0 |
| Agriculture | 117 | 114 | -3 | -2.6 | 637,774 | 614,191 | -23,583 | -3.7 | 419 | 414 | -5 | -1.2 |
| Mining | 3,516 | 3,858 | 342 | 9.7 | 71,977,982 | 87,716,444 | 15,738,462 | 21.9 | 1,575 | 1,749 | 174 | 11.0 |
| Utilities | 129 | 135 | 6 | 4.7 | 2,218,148 | 2,243,725 | 25,577 | 1.2 | 1,323 | 1,278 | -45 | -3.4 |
| Construction | 2,327 | 2,567 | 240 | 10.3 | 26,206,435 | 31,433,157 | 5,226,722 | 19.9 | 866 | 942 | 76 | 8.8 |
| Manufacturing | 1,657 | 1,860 | 203 | 12.3 | 20,045,259 | 24,219,134 | 4,173,875 | 20.8 | 931 | 1,002 | 71 | 7.6 |
| Wholesale Trade | 2,404 | 2,687 | 283 | 11.8 | 33,978,790 | 42,020,909 | 8,042,119 | 23.7 | 1,087 | 1,203 | 116 | 10.7 |
| Retail Trade | 4,470 | 4,636 | 166 | 3.7 | 30,047,106 | 32,592,515 | 2,545,409 | 8.5 | 517 | 541 | 24 | 4.6 |
| Transportation & Warehousing | 945 | 1,080 | 135 | 14.3 | 11,461,436 | 14,430,581 | 2,969,145 | 25.9 | 933 | 1,028 | 95 | 10.2 |
| Information | 476 | 470 | -6 | -1.3 | 4,394,959 | 4,695,889 | 300,930 | 6.8 | 710 | 769 | 59 | 8.3 |
| Finance & Insurance | 1,016 | 1,028 | 12 | 1.2 | 14,289,735 | 15,104,078 | 814,343 | 5.7 | 1,082 | 1,130 | 48 | 4.4 |
| Real Estate & Rental & Leasing | 866 | 882 | 16 | 1.8 | 9,588,965 | 11,092,246 | 1,503,281 | 15.7 | 852 | 967 | 115 | 13.5 |
| Professional & Technical Services | 1,389 | 1,492 | 103 | 7.4 | 17,600,705 | 18,878,914 | 1,278,209 | 7.3 | 975 | 973 | -2 | -0.2 |
| Mgmt. of Companies & Enterprises | 155 | 156 | 1 | 0.6 | 3,388,018 | 3,495,806 | 107,788 | 3.2 | 1,681 | 1,724 | 43 | 2.6 |
| Administrative & Waste Services | 1,150 | 1,328 | 178 | 15.5 | 7,791,015 | 10,087,211 | 2,296,196 | 29.5 | 521 | 584 | 63 | 12.1 |
| Educational Services | 159 | 148 | -11 | -6.9 | 616,075 | 865,320 | 249,245 | 40.5 | 298 | 450 | 152 | 51.0 |
| Health Care & Social Assistance | 5,617 | 5,480 | -137 | -2.4 | 59,779,807 | 61,265,312 | 1,485,505 | 2.5 | 819 | 860 | 41 | 5.0 |
| Ambulatory Health Care Services | 1,852 | 1,944 | 92 | 5.0 | 27,702,260 | 29,267,122 | 1,564,862 | 5.6 | 1,151 | 1,158 | 7 | 0.6 |
| Hospitals | 1,804 | 1,605 | -199 | -11.0 | 20,453,205 | 19,871,121 | -582,084 | -2.8 | 872 | 952 | 80 | 9.2 |
| Nursing & Residential Care Facilities | 937 | 922 | -15 | -1.6 | 6,544,970 | 6,978,596 | 433,626 | 6.6 | 537 | 582 | 45 | 8.4 |
| Social Assistance | 1,023 | 1,009 | -14 | -1.4 | 5,079,372 | 5,148,473 | 69,101 | 1.4 | 382 | 393 | 11 | 2.9 |
| Arts, Entertainment, & Recreation | 348 | 409 | 61 | 17.5 | 1,266,144 | 1,414,936 | 148,792 | 11.8 | 280 | 266 | -14 | -5.0 |
| Accommodation & Food Services | 3,440 | 3,693 | 253 | 7.4 | 12,607,739 | 14,253,470 | 1,645,731 | 13.1 | 282 | 297 | 15 | 5.3 |
| Other Services | 1,786 | 1,982 | 196 | 11.0 | 18,347,302 | 21,338,455 | 2,991,153 | 16.3 | 790 | 828 | 38 | 4.8 |
| Total Government | 5,737 | 5,748 | 11 | 0.2 | $66,660,613 | $68,475,385 | $1,814,772 | 2.7 | $894 | $916 | $22 | 2.5 |
| Federal Government | 687 | 667 | -20 | -2.9 | 10,713,825 | 11,131,007 | 417,182 | 3.9 | 1,200 | 1,284 | 84 | 7.0 |
| State Government | 693 | 711 | 18 | 2.6 | 9,241,458 | 9,564,444 | 322,986 | 3.5 | 1,026 | 1,035 | 9 | 0.9 |
| Local Government | 4,357 | 4,369 | 12 | 0.3 | 46,705,330 | 47,779,934 | 1,074,604 | 2.3 | 825 | 841 | 16 | 1.9 |
| Local Government Education | ND | ND | ND | ND | ND | ND | ND | ND | ND | ND | ND | ND |
| aPreliminary. | ||||||||||||
| bNorth American Industry Classification System. | ||||||||||||
| ND-Not disclosable due to confidentiality of information. | ||||||||||||
| Source: Quarterly Census of Employment and Wages, developed through a cooperativeprogram between Research & Planning and the U.S. Bureau of Labor Statistics. Extract date: July 2012. | ||||||||||||
| NAICSb Title | Average Monthly Employment | Total Payroll | Average Weekly Wage | |||||||||
|---|---|---|---|---|---|---|---|---|---|---|---|---|
| First Quarter | Change | First Quarter | Change | First Quarter | Change | |||||||
| 2011 | 2012 | n | % | 2011 | 2012 | $ | % | 2011 | 2012 | $ | % | |
| Total, All Industries | 41,872 | 42,715 | 843 | 2.0 | $400,300,499 | $439,104,413 | $38,803,914 | 9.7 | $735 | $791 | $56 | 7.6 |
| Total Private | 28,089 | 29,015 | 926 | 3.3 | $233,948,674 | $262,620,689 | $28,672,015 | 12.3 | $641 | $696 | $55 | 8.6 |
| Agriculture | 261 | 273 | 12 | 4.6 | 1,790,160 | 1,997,588 | 207,428 | 11.6 | 528 | 563 | 35 | 6.6 |
| Mining | 90 | 212 | 122 | 135.6 | 1,196,811 | 4,153,491 | 2,956,680 | 247.0 | 1,023 | 1,507 | 484 | 47.3 |
| Utilities | 139 | 139 | 0 | 0.0 | 2,827,140 | 3,293,689 | 466,549 | 16.5 | 1,565 | 1,823 | 258 | 16.5 |
| Construction | 2,214 | 2,404 | 190 | 8.6 | 20,348,206 | 23,085,048 | 2,736,842 | 13.5 | 707 | 739 | 32 | 4.5 |
| Manufacturing | 1,441 | 1,335 | -106 | -7.4 | 19,319,206 | 17,322,598 | -1,996,608 | -10.3 | 1,031 | 998 | -33 | -3.2 |
| Wholesale Trade | 801 | 885 | 84 | 10.5 | 9,894,561 | 11,826,107 | 1,931,546 | 19.5 | 950 | 1,028 | 78 | 8.2 |
| Retail Trade | 5,110 | 5,229 | 119 | 2.3 | 32,579,566 | 34,686,329 | 2,106,763 | 6.5 | 490 | 510 | 20 | 4.1 |
| Transportation & Warehousing | 2,256 | 2,394 | 138 | 6.1 | 22,556,638 | 24,931,496 | 2,374,858 | 10.5 | 769 | 801 | 32 | 4.2 |
| Information | 1,080 | 1,135 | 55 | 5.1 | 10,935,144 | 12,150,045 | 1,214,901 | 11.1 | 779 | 823 | 44 | 5.6 |
| Finance & Insurance | 1,649 | 1,624 | -25 | -1.5 | 19,281,950 | 19,948,898 | 666,948 | 3.5 | 899 | 945 | 46 | 5.1 |
| Real Estate & Rental & Leasing | 481 | 542 | 61 | 12.7 | 4,300,542 | 5,063,564 | 763,022 | 17.7 | 688 | 719 | 31 | 4.5 |
| Prof. & Technical Services | 1,496 | 1,611 | 115 | 7.7 | 17,547,106 | 21,505,464 | 3,958,358 | 22.6 | 902 | 1,027 | 125 | 13.9 |
| Mgmt. of Companies & Enterprises | 77 | 65 | -12 | -15.6 | 1,304,314 | 1,305,400 | 1,086 | 0.1 | 1,303 | 1,545 | 242 | 18.6 |
| Administrative & Waste Services | 1,471 | 1,543 | 72 | 4.9 | 8,248,393 | 9,223,907 | 975,514 | 11.8 | 431 | 460 | 29 | 6.7 |
| Educational Services | 223 | 246 | 23 | 10.3 | 1,347,813 | 1,562,856 | 215,043 | 16.0 | 465 | 489 | 24 | 5.2 |
| Health Care & Social Assistance | 3,938 | 3,946 | 8 | 0.2 | 36,904,771 | 39,623,927 | 2,719,156 | 7.4 | 721 | 772 | 51 | 7.1 |
| Ambulatory Health Care Services | 1,837 | 1,885 | 48 | 2.6 | 24,803,573 | 26,782,213 | 1,978,640 | 8.0 | 1,039 | 1,093 | 54 | 5.2 |
| Nursing & Residential Care Facilties | 863 | 860 | -3 | -0.3 | 5,836,603 | 6,266,114 | 429,511 | 7.4 | 520 | 560 | 40 | 7.7 |
| Hospitals & Social Assistance | 1,238 | 1,200 | -38 | -3.1 | 6,264,595 | 6,575,600 | 311,005 | 5.0 | 389 | 422 | 33 | 8.5 |
| Arts, Entertainment, & Recreation | 267 | 248 | -19 | -7.1 | 792,058 | 831,489 | 39,431 | 5.0 | 228 | 258 | 30 | 13.2 |
| Accommodation & Food Services | 3,862 | 3,942 | 80 | 2.1 | 13,922,399 | 20,926,334 | 7,003,935 | 50.3 | 277 | 408 | 131 | 47.3 |
| Other Services | 1,233 | 1,242 | 9 | 0.7 | 8,851,896 | 9,182,459 | 330,563 | 3.7 | 552 | 569 | 17 | 3.1 |
| Total Government | 13,783 | 13,700 | -83 | -0.6 | $166,351,825 | $176,483,724 | $10,131,899 | 6.1 | $928 | $991 | $63 | 6.8 |
| Federal Government | 2,650 | 2,569 | -81 | -3.1 | 37,853,735 | 42,065,995 | 4,212,260 | 11.1 | 1,099 | 1,260 | 161 | 14.6 |
| State Government | 4,080 | 4,021 | -59 | -1.4 | 57,053,959 | 57,505,284 | 451,325 | 0.8 | 1,076 | 1,100 | 24 | 2.2 |
| Local Government | 7,053 | 7,110 | 57 | 0.8 | 71,444,131 | 76,912,445 | 5,468,314 | 7.7 | 779 | 832 | 53 | 6.8 |
| Local Government Education | 3,806 | 3,808 | 2 | 0.0 | 37,080,841 | 38,137,704 | 1,056,863 | 2.9 | 749 | 770 | 21 | 2.8 |
| aPreliminary. | ||||||||||||
| bNorth American Industry Classification System. | ||||||||||||
| Source: Quarterly Census of Employment and Wages, developed through a cooperative program between Research & Planning and the U.S. Bureau of Labor Statistics. | ||||||||||||