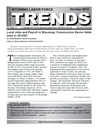
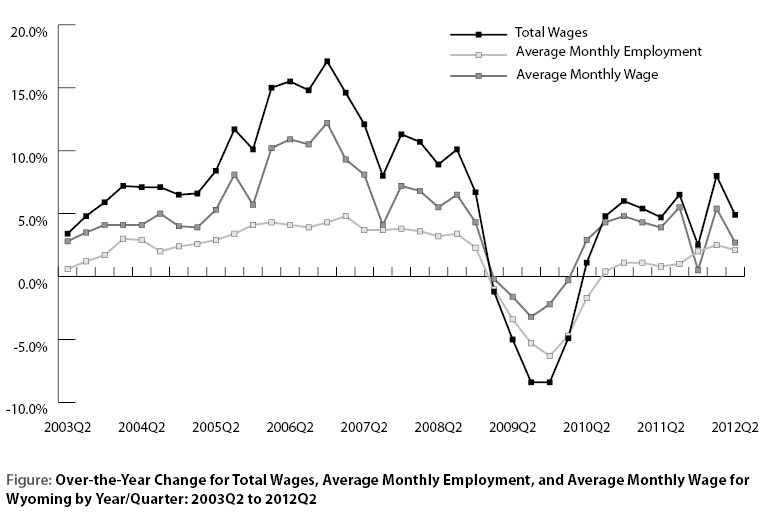
Total Wages, Average Monthly Employment, and Average Monthly Wage Changes for Wyoming by Year/Quarter: 2003Q2 to 2012Q2
Related Figure
Year/
Quarter |
Total
Wages |
%
Change |
Average
Monthly
Employment |
%
Change |
Average
Monthly
Wage |
%
Change |
|
2003/2
|
$1,781,866,184
|
|
243,630
|
|
$2,437.94
|
|
|
2004/2
|
$1,909,209,013
|
7.1%
|
250,786
|
2.9%
|
$2,537.63
|
4.1%
|
|
2003/3
|
$1,828,341,523
|
|
250,079
|
|
$2,437.02
|
|
|
2004/3
|
$1,958,379,343
|
7.1%
|
255,077
|
2.0%
|
$2,559.20
|
5.0%
|
|
2003/4
|
$1,947,865,484
|
|
243,210
|
|
$2,669.66
|
|
|
2004/4
|
$2,074,503,790
|
6.5%
|
248,966
|
2.4%
|
$2,777.49
|
4.0%
|
|
2004/1
|
$1,800,717,857
|
|
237,527
|
|
$2,527.04
|
|
|
2005/1
|
$1,919,538,984
|
6.6%
|
243,759
|
2.6%
|
$2,624.91
|
3.9%
|
|
2004/2
|
$1,909,209,013
|
|
250,786
|
|
$2,537.63
|
|
|
2005/2
|
$2,068,675,609
|
8.4%
|
258,031
|
2.9%
|
$2,672.39
|
5.3%
|
|
2004/3
|
$1,958,379,343
|
|
255,077
|
|
$2,559.20
|
|
|
2005/3
|
$2,188,006,458
|
11.7%
|
263,747
|
3.4%
|
$2,765.28
|
8.1%
|
|
2004/4
|
$2,074,503,790
|
|
248,966
|
|
$2,777.49
|
|
|
2005/4
|
$2,283,976,604
|
10.1%
|
259,256
|
4.1%
|
$2,936.58
|
5.7%
|
|
2005/1
|
$1,919,538,984
|
|
243,759
|
|
$2,624.91
|
|
|
2006/1
|
$2,206,882,734
|
15.0%
|
254,302
|
4.3%
|
$2,892.73
|
10.2%
|
|
2005/2
|
$2,068,675,609
|
|
258,031
|
|
$2,672.39
|
|
|
2006/2
|
$2,389,394,775
|
15.5%
|
268,726
|
4.1%
|
$2,963.86
|
10.9%
|
|
2005/3
|
$2,188,006,458
|
|
263,747
|
|
$2,765.28
|
|
|
2006/3
|
$2,511,603,105
|
14.8%
|
274,060
|
3.9%
|
$3,054.81
|
10.5%
|
|
2005/4
|
$2,283,976,604
|
|
259,256
|
|
$2,936.58
|
|
|
2006/4
|
$2,674,775,271
|
17.1%
|
270,498
|
4.3%
|
$3,296.11
|
12.2%
|
|
2006/1
|
$2,206,882,734
|
|
254,302
|
|
$2,892.73
|
|
|
2007/1
|
$2,528,871,913
|
14.6%
|
266,599
|
4.8%
|
$3,161.89
|
9.3%
|
|
2006/2
|
$2,389,394,775
|
|
268,726
|
|
$2,963.86
|
|
|
2007/2
|
$2,679,641,341
|
12.1%
|
278,792
|
3.7%
|
$3,203.87
|
8.1%
|
|
2006/3
|
$2,511,603,105
|
|
274,060
|
|
$3,054.81
|
|
|
2007/3
|
$2,712,325,140
|
8.0%
|
284,317
|
3.7%
|
$3,179.93
|
4.1%
|
|
2006/4
|
$2,674,775,271
|
|
270,498
|
|
$3,296.11
|
|
|
2007/4
|
$2,976,397,551
|
11.3%
|
280,888
|
3.8%
|
$3,532.13
|
7.2%
|
|
2007/1
|
$2,528,871,913
|
|
266,599
|
|
$3,161.89
|
|
|
2008/1
|
$2,798,237,273
|
10.7%
|
276,195
|
3.6%
|
$3,377.13
|
6.8%
|
|
2007/2
|
$2,679,641,341
|
|
278,792
|
|
$3,203.87
|
|
|
2008/2
|
$2,918,008,721
|
8.9%
|
287,780
|
3.2%
|
$3,379.91
|
5.5%
|
|
2007/3
|
$2,712,325,140
|
|
284,317
|
|
$3,179.93
|
|
|
2008/3
|
$2,985,771,294
|
10.1%
|
293,895
|
3.4%
|
$3,386.44
|
6.5%
|
|
2007/4
|
$2,976,397,551
|
|
280,888
|
|
$3,532.13
|
|
|
2008/4
|
$3,177,223,682
|
6.7%
|
287,478
|
2.3%
|
$3,684.02
|
4.3%
|
|
2008/1
|
$2,798,237,273
|
|
276,195
|
|
$3,377.13
|
|
|
2009/1
|
$2,764,364,307
|
-1.2%
|
273,471
|
-1.0%
|
$3,369.48
|
-0.2%
|
|
2008/2
|
$2,918,008,721
|
|
287,780
|
|
$3,379.91
|
|
|
2009/2
|
$2,773,191,493
|
-5.0%
|
277,897
|
-3.4%
|
$3,326.40
|
-1.6%
|
|
2008/3
|
$2,985,771,294
|
|
293,895
|
|
$3,386.44
|
|
|
2009/3
|
$2,736,056,780
|
-8.4%
|
278,234
|
-5.3%
|
$3,277.88
|
-3.2%
|
|
2008/4
|
$3,177,223,682
|
|
287,478
|
|
$3,684.02
|
|
|
2009/4
|
$2,911,594,084
|
-8.4%
|
269,439
|
-6.3%
|
$3,602.04
|
-2.2%
|
|
2009/1
|
$2,764,364,307
|
|
273,471
|
|
$3,369.48
|
|
|
2010/1
|
$2,627,558,836
|
-4.9%
|
260,726
|
-4.7%
|
$3,359.29
|
-0.3%
|
|
2009/2
|
$2,773,191,493
|
|
277,897
|
|
$3,326.40
|
|
|
2010/2
|
$2,802,848,365
|
1.1%
|
273,044
|
-1.7%
|
$3,421.73
|
2.9%
|
|
2009/3
|
$2,736,056,780
|
|
278,234
|
|
$3,277.88
|
|
|
2010/3
|
$2,866,694,334
|
4.8%
|
279,429
|
0.4%
|
$3,419.71
|
4.3%
|
|
2009/4
|
$2,911,594,084
|
|
269,439
|
|
$3,602.04
|
|
|
2010/4
|
$3,087,069,661
|
6.0%
|
272,511
|
1.1%
|
$3,776.08
|
4.8%
|
|
2010/1
|
$2,627,558,836
|
|
260,726
|
|
$3,359.29
|
|
|
2011/1
|
$2,769,072,169
|
5.4%
|
263,558
|
1.1%
|
$3,502.17
|
4.3%
|
|
2010/2
|
$2,802,848,365
|
|
273,044
|
|
$3,421.73
|
|
|
2011/2
|
$2,933,492,659
|
4.7%
|
275,169
|
0.8%
|
$3,553.56
|
3.9%
|
|
2010/3
|
$2,866,694,334
|
|
279,429
|
|
$3,419.71
|
|
|
2011/3
|
$3,053,914,162
|
6.5%
|
282,231
|
1.0%
|
$3,606.87
|
5.5%
|
|
2010/4
|
$3,087,069,661
|
|
272,511
|
|
$3,776.08
|
|
|
2011/4
|
$3,165,745,021
|
2.5%
|
278,015
|
2.0%
|
$3,795.65
|
0.5%
|
|
2011/1
|
$2,769,072,169
|
|
263,558
|
|
$3,502.17
|
|
|
2012/1
|
$2,991,246,352
|
8.0%
|
270,073
|
2.5%
|
$3,691.90
|
5.4%
|
|
2011/2
|
$2,933,492,659
|
|
275,169
|
|
$3,553.56
|
|
|
2012/2
|
$3,076,205,859
|
4.9%
|
280,870
|
2.1%
|
$3,650.81
|
2.7%
|
|
|
| Source: Quarterly Census of Employment and Wages. |
 |
Last modified
by Phil Ellsworth.
