Labor Market Information > Wyoming Labor Force Trends > October 2011 > Initial Claims
Wyoming Normalizeda Unemployment Insurance Statistics: Initial Claims
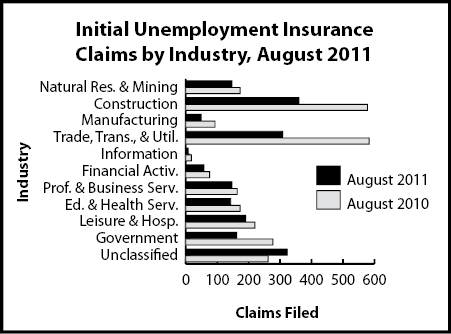
Initial claims declined by 12.5% over the month and 27.6% over the year. The largest over-the-year numeric decline in a single sector was observed in construction (-218).
| Claims Filed | Percent Change Claims Filed |
||||||
|---|---|---|---|---|---|---|---|
| Aug 11 | Aug 11 | ||||||
| Aug 11 | Jul 11 | Aug 10 | Jul 11 | Aug 10 | |||
| Total Claims Filed | 1,945 | 2,222 | 2,687 | -12.5 | -27.6 | ||
| Goods-Producing | 556 | 664 | 844 | -16.3 | -34.1 | ||
| Natural Resources & Mining | 147 | 160 | 173 | -8.1 | -15.0 | ||
| Mining | 132 | 144 | 154 | -8.3 | -14.3 | ||
| Oil & Gas Extraction | 12 | 10 | 8 | 20.0 | 50.0 | ||
| Construction | 360 | 434 | 578 | -17.1 | -37.7 | ||
| Manufacturing | 49 | 70 | 93 | -30.0 | -47.3 | ||
| Service-Providing | 904 | 977 | 1,304 | -7.5 | -30.7 | ||
| Trade, Transportation, & Utilities | 308 | 324 | 583 | -4.9 | -47.2 | ||
| Wholesale Trade | 50 | 44 | 162 | 13.6 | -69.1 | ||
| Retail Trade | 184 | 188 | 346 | -2.1 | -46.8 | ||
| Transp., Warehousing & Utilities | 74 | 92 | 75 | -19.6 | -1.3 | ||
| Information | 8 | 14 | 18 | -42.9 | -55.6 | ||
| Financial Activities | 58 | 54 | 76 | 7.4 | -23.7 | ||
| Professional & Business Services | 147 | 154 | 164 | -4.5 | -10.4 | ||
| Educational & Health Services | 143 | 173 | 173 | -17.3 | -17.3 | ||
| Leisure & Hospitality | 191 | 206 | 220 | -7.3 | -13.2 | ||
| Other Services, except Public Admin. | 49 | 52 | 70 | -5.8 | -30.0 | ||
| Government | 162 | 214 | 277 | -24.3 | -41.5 | ||
| Federal Government | 47 | 38 | 116 | 23.7 | -59.5 | ||
| State Government | 22 | 32 | 26 | -31.3 | -15.4 | ||
| Local Government | 93 | 144 | 135 | -35.4 | -31.1 | ||
| Local Education | 29 | 53 | 52 | -45.3 | -44.2 | ||
| Unclassified | 323 | 367 | 262 | -12.0 | 23.3 | ||
| Claims Filed | Percent Change Claims Filed |
|||||
|---|---|---|---|---|---|---|
| Aug 11 | Aug 11 | |||||
| Aug 11 | Jul 11 | Aug 10 | Jul 11 | Aug 10 | ||
| Total Claims Filed | 282 | 330 | 354 | -14.5 | -20.3 | |
| Goods-Producing | 76 | 70 | 102 | 8.6 | -25.5 | |
| Construction | 58 | 58 | 92 | 0.0 | -37.0 | |
| Service-Providing | 160 | 217 | 191 | -26.3 | -16.2 | |
| Trade, Transp., & Utilities | 47 | 79 | 70 | -40.5 | -32.9 | |
| Financial Activities | 12 | 15 | 18 | -20.0 | -33.3 | |
| Professional & Business Services | 33 | 41 | 33 | -19.5 | 0.0 | |
| Educational & Health Services | 29 | 30 | 31 | -3.3 | -6.5 | |
| Leisure & Hospitality | 30 | 39 | 26 | -23.1 | 15.4 | |
| Government | 28 | 35 | 45 | -20.0 | -37.8 | |
| Unclassified | 18 | 8 | 16 | 125.0 | 12.5 | |
| Claims Filed | Percent Change Claims Filed |
||||||||
|---|---|---|---|---|---|---|---|---|---|
| Aug 11 | Aug 11 | ||||||||
| Aug 11 | Jul 11 | Aug 10 | Jul 11 | Aug 10 | |||||
| Total Claims Filed | 264 | 264 | 462 | 0.0 | -42.9 | ||||
| Goods-Producing | 78 | 90 | 78 | -13.3 | 0.0 | ||||
| Construction | 47 | 43 | 48 | 9.3 | -2.1 | ||||
| Service-Providing | 167 | 150 | 341 | 11.3 | -51.0 | ||||
| Trade, Transp., & Utilities | 64 | 54 | 227 | 18.5 | -71.8 | ||||
| Financial Activities | 11 | 3 | 10 | 266.7 | 10.0 | ||||
| Professional & Business Svcs. | 23 | 15 | 25 | 53.3 | -8.0 | ||||
| Educational & Health Svcs. | 30 | 37 | 34 | -18.9 | -11.8 | ||||
| Leisure & Hospitality | 23 | 27 | 29 | -14.8 | -20.7 | ||||
| Government | 13 | 19 | 34 | -31.6 | -61.8 | ||||
| Unclassified | 6 | 5 | 9 | 20.0 | -33.3 | ||||
aAn average month is considered 4.33 weeks. If a month has four weeks, the normalization factor is 1.0825. If the month has five weeks, the normalization factor is 0.866. The number of raw claims is multiplied by the normalization factor to achieve the normalized claims counts.