Labor Market Information > Wyoming Labor Force Trends > October 2011 > Continued Claims
Wyoming Normalizeda Unemployment Insurance Statistics: Continued Claims
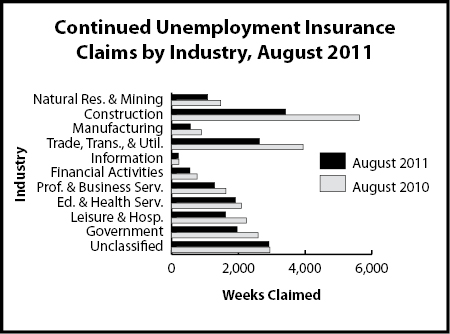
Continued weeks claimed declined compared to August 2010 (-26.3%). Benefit exhaustion rates increased by 0.5% to 12.1% for the same comparison period.
| Continued Weeks Claimed |
Percent Change Weeks Claimed |
||||||
|---|---|---|---|---|---|---|---|
| Aug 11 | Aug 11 | ||||||
| Aug 11 | Jul 11 | Aug 10 | Jul 11 | Aug 10 | |||
| Wyoming Statewide | |||||||
| Total Continued Weeks Claimed | 18,651 | 20,595 | 25,317 | -9.4 | -26.3 | ||
| Extended Benefit Weeks Claimed | 12,670 | 13,255 | 25,561 | -4.4 | -50.4 | ||
| Total Unique Claimantsb | 4,480 | 5,894 | 7,159 | -24.0 | -37.4 | ||
| Benefit Exhaustions | 541 | 684 | 827 | -20.9 | -34.6 | ||
| Benefit Exhaustion Rates | 12.1% | 11.6% | 11.6% | 0.5% | 0.5% | ||
| Total Goods-Producing | 5,064 | 6,001 | 7,990 | -15.6 | -36.6 | ||
| Natural Resources and Mining | 1,078 | 1,193 | 1,468 | -9.6 | -26.6 | ||
| Mining | 940 | 1,080 | 1,298 | -13.0 | -27.6 | ||
| Oil & Gas Extraction | 87 | 87 | 90 | 0.0 | -3.3 | ||
| Construction | 3,419 | 4,101 | 5,631 | -16.6 | -39.3 | ||
| Manufacturing | 567 | 707 | 891 | -19.8 | -36.4 | ||
| Total Service-Providing | 8,704 | 9,484 | 11,781 | -8.2 | -26.1 | ||
| Trade, Transportation, and Utilities | 2,633 | 2,855 | 3,940 | -7.8 | -33.2 | ||
| Wholesale Trade | 435 | 432 | 795 | 0.7 | -45.3 | ||
| Retail Trade | 1,648 | 1,851 | 2,488 | -11.0 | -33.8 | ||
| Transp., Warehousing and Utilities | 550 | 572 | 657 | -3.8 | -16.3 | ||
| Information | 204 | 202 | 218 | 1.0 | -6.4 | ||
| Financial Activities | 551 | 480 | 766 | 14.8 | -28.1 | ||
| Professional and Business Services | 1,291 | 1,471 | 1,630 | -12.2 | -20.8 | ||
| Educational and Health Services | 1,911 | 1,929 | 2,091 | -0.9 | -8.6 | ||
| Leisure and Hospitality | 1,620 | 1,968 | 2,239 | -17.7 | -27.6 | ||
| Other Services, except Public Admin. | 494 | 579 | 897 | -14.7 | -44.9 | ||
| Total Government | 1,964 | 2,094 | 2,596 | -6.2 | -24.3 | ||
| Federal Government | 335 | 368 | 898 | -9.0 | -62.7 | ||
| State Government | 259 | 255 | 267 | 1.6 | -3.0 | ||
| Local Government | 1,370 | 1,471 | 1,431 | -6.9 | -4.3 | ||
| Local Education | 474 | 506 | 465 | -6.3 | 1.9 | ||
| Unclassified | 2,919 | 3,016 | 2,950 | -3.2 | -1.1 | ||
| Laramie County | |||||||
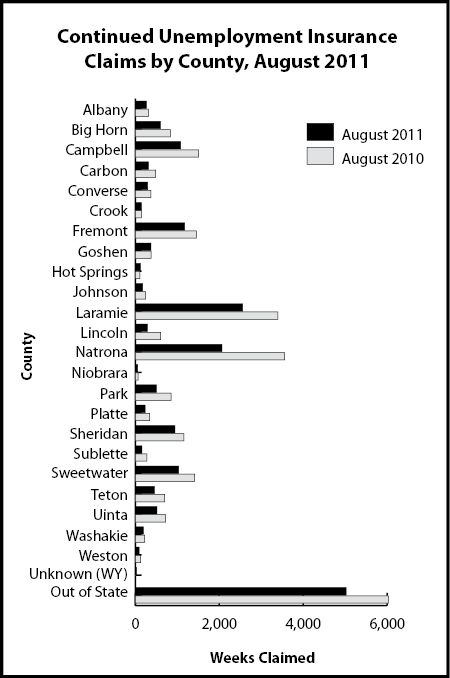
| Total Continued Weeks Claimed | 2,559 | 2,790 | 3,401 | -8.3 | -24.8 | ||
| Total Unique Claimants | 636 | 803 | 969 | -20.8 | -34.4 | ||
| Goods-Producing | 524 | 584 | 735 | -10.3 | -28.7 | ||
| Construction | 404 | 437 | 599 | -7.6 | -32.6 | ||
| Service-Providing | 1,618 | 1,745 | 2,018 | -7.3 | -19.8 | ||
| Trade, Transportation, and Utilities | 429 | 487 | 721 | -11.9 | -40.5 | ||
| Financial Activities | 118 | 119 | 171 | -0.8 | -31.0 | ||
| Professional and Business Services | 274 | 297 | 261 | -7.7 | 5.0 | ||
| Educational and Health Services | 425 | 450 | 405 | -5.6 | 4.9 | ||
| Leisure and Hospitality | 238 | 240 | 258 | -0.8 | -7.8 | ||
| Government | 323 | 384 | 518 | -15.9 | -37.6 | ||
| Unclassified | 94 | 77 | 130 | 22.1 | -27.7 | ||
| Natrona County | |||||||
| Total Continued Weeks Claimed | 2,065 | 2,218 | 3,561 | -6.9 | -42.0 | ||
| Total Unique Claimants | 506 | 628 | 1,063 | -19.4 | -52.4 | ||
| Goods-Producing | 522 | 532 | 961 | -1.9 | -45.7 | ||
| Construction | 255 | 254 | 528 | 0.4 | -51.7 | ||
| Service-Providing | 1,368 | 1,523 | 2,311 | -10.2 | -40.8 | ||
| Trade, Transportation, and Utilities | 490 | 531 | 882 | -7.7 | -44.4 | ||
| Financial Activities | 71 | 78 | 158 | -9.0 | -55.1 | ||
| Professional and Business Services | 167 | 236 | 264 | -29.2 | -36.7 | ||
| Educational and Health Services | 306 | 323 | 431 | -5.3 | -29.0 | ||
| Leisure and Hospitality | 205 | 187 | 396 | 9.6 | -48.2 | ||
| Government | 129 | 121 | 229 | 6.6 | -43.7 | ||
| Unclassified | 46 | 42 | 60 | 9.5 | -23.3 | ||
| *Does not include claimants receiving extended benefits | |||||||
aAn average month is considered 4.33 weeks. If a month has four weeks, the normalization factor is 1.0825. If the month has five weeks, the normalization factor is 0.866. The number of raw claims is multiplied by the normalization factor to achieve the normalized claims counts.
bDoes not include claimants receiving extended benefits.