
Economic Indicators
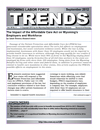
The Baker Hughes rig count for Wyoming fell from 50 in July 2011 to 46 in July 2012, an 8.0% decrease.
|
Jul |
Jun |
Jul |
Percent Change |
||||
|---|---|---|---|---|---|---|---|
|
Month |
Year |
||||||
|
Wyoming Total Nonfarm Employment |
293,900 |
298,200 |
294,700 |
-1.4 |
-0.3 |
||
|
Wyoming State Government |
16,600 |
16,700 |
16,500 |
-0.6 |
0.6 |
||
|
Laramie County Nonfarm Employment |
45,900 |
46,400 |
44,900 |
-1.1 |
2.2 |
||
|
Natrona County Nonfarm Employment |
41,400 |
41,800 |
40,300 |
-1.0 |
2.7 |
||
|
Selected U.S. Employment Data |
|||||||
|
U.S. Multiple Jobholders |
6,741,000 |
6,707,000 |
6,724,000 |
0.5 |
0.3 |
||
|
As a percent of all workers |
4.7% |
4.7% |
4.8% |
N/A |
N/A |
||
|
U.S. Discouraged Workers |
852,000 |
821,000 |
1,119,000 |
3.8 |
-23.9 |
||
|
U.S. Part Time for Economic Reasons |
8,316,000 |
8,394,000 |
8,514,000 |
-0.9 |
-2.3 |
||
|
Wyoming Unemployment Insurance |
|||||||
|
Weeks Compensated |
17,689 |
15,519 |
17,288 |
14.0 |
2.3 |
||
|
Benefits Paid |
$6,111,804 |
$5,319,736 |
$5,633,695 |
14.9 |
8.5 |
||
|
Average Weekly Benefit Payment |
$345.51 |
$342.79 |
$325.87 |
0.8 |
6.0 |
||
|
State Insured Covered Jobs1 |
272,954 |
277,518 |
266,887 |
-1.6 |
2.3 |
||
|
Insured Unemployment Rate |
2.1% |
2.1% |
1.8% |
N/A |
N/A |
||
|
Consumer Price Index (U) for All U.S. Urban Consumers |
|||||||
|
(1982 to 1984 = 100) |
|||||||
|
All Items |
229.1 |
229.5 |
225.9 |
-0.2 |
1.4 |
||
|
Food & Beverages |
233.6 |
233.5 |
228.3 |
0.0 |
2.3 |
||
|
Housing |
223.3 |
223.1 |
220.2 |
0.1 |
1.4 |
||
|
Apparel |
122.3 |
125.2 |
118.8 |
-2.3 |
3.0 |
||
|
Transportation |
214.3 |
216.4 |
216.2 |
-1.0 |
-0.9 |
||
|
Medical Care |
416.8 |
415.3 |
400.3 |
0.3 |
4.1 |
||
|
Recreation (Dec. 1997=100) |
114.9 |
115.1 |
113.5 |
-0.1 |
1.3 |
||
|
Education & Communication (Dec. 1997=100) |
133.5 |
133.5 |
130.9 |
0.1 |
2.1 |
||
|
Other Goods & Services |
395.4 |
394.0 |
386.5 |
0.4 |
2.3 |
||
|
Producer Prices (1982 to 1984 = 100) |
|||||||
|
All Commodities |
200.0 |
200.4 |
204.6 |
-0.2 |
-2.2 |
||
|
Wyo. Bldg. Permits (New Privately Owned Housing Units Authorized) |
|||||||
|
Total Units |
133 |
159 |
288 |
-16.4 |
-53.8 |
||
|
Valuation |
$29,324,000 |
$41,531,000 |
$47,570,000 |
-29.4 |
-38.4 |
||
|
Single Family Homes |
126 |
147 |
164 |
-14.3 |
-23.2 |
||
|
Valuation |
$28,689,000 |
$40,278,000 |
$38,162,000 |
-28.8 |
-24.8 |
||
|
Casper MSA2 Building Permits |
21 |
26 |
67 |
-19.2 |
-68.7 |
||
|
Valuation |
$4,516,000 |
$4,979,000 |
$5,963,000 |
-9.3 |
-24.3 |
||
|
Cheyenne MSA Building Permits |
27 |
34 |
14 |
-20.6 |
92.9 |
||
|
Valuation |
$3,242,000 |
$6,953,000 |
$2,398,000 |
-53.4 |
35.2 |
||
|
Baker Hughes North American Rotary Rig Count for Wyoming |
46 |
40 |
50 |
15.0 |
-8.0 |
||
|
|||||||
|
1Local Area Unemployment Statistics Program estimates. |
|||||||
|
2Metropolitan Statistical Area. |
|||||||
|
Note: Production worker hours and earnings data have been dropped from the Economic Indicators page because of problems with accuracy due to a small sample size and high item nonresponse. The Bureau of Labor Statistics will continue to publish these data online at http://www.bls.gov/eag/eag.wy.htm. |
|||||||