
Labor Market Information > Wyoming Labor Force Trends > September 2011 > Economic Indicators
Economic Indicators
The consumer price index for transportation increased by 12.0% from July 2010 to July 2011, possibly reflecting the impact of higher gasoline prices.
| July 2011 (p) |
June 2011 (r) |
July 2010 (b) |
Percent Change | ||||
|---|---|---|---|---|---|---|---|
| Month | Year | ||||||
| Wyoming Total Nonfarm Employment | 295,400 | 299,200 | 288,300 | -1.3 | 2.5 | ||
| Wyoming State Government | 16,500 | 16,700 | 16,200 | -1.2 | 1.9 | ||
| Laramie County Nonfarm Employment | 44,300 | 44,300 | 43,800 | 0.0 | 1.1 | ||
| Natrona County Nonfarm Employment | 39,900 | 40,000 | 38,800 | -0.3 | 2.8 | ||
| Selected U.S. Employment Data | |||||||
| U.S. Multiple Jobholders | 6,724,000 | 6,861,000 | 6,579,000 | -2.0 | 2.2 | ||
| As a percent of all workers | 4.8% | 4.9% | 4.7% | N/A | N/A | ||
| U.S. Discouraged Workers | 1,119,000 | 982,000 | 1,185,000 | 14.0 | -5.6 | ||
| U.S. Part Time for Economic Reasons | 8,514,000 | 8,738,000 | 8,737,000 | -2.6 | -2.6 | ||
| Wyoming Unemployment Insurance | |||||||
| Weeks Compensated | 17,288 | 24,187 | 23,321 | -28.5 | -25.9 | ||
| Benefits Paid | $5,633,695 | $7,826,502 | $7,705,320 | -28.0 | -26.9 | ||
| Average Weekly Benefit Payment | $325.87 | $323.58 | $330.40 | 0.7 | -1.4 | ||
| State Insured Covered Jobs1 | 264,502 | 269,076 | 263,128 | -1.7 | 0.5 | ||
| Insured Unemployment Rate | 1.8% | 2.1% | 2.5% | N/A | N/A | ||
| Consumer Price Index (U) for All U.S. Urban Consumers (1982 to 1984 = 100) | |||||||
| All Items | 225.9 | 225.7 | 218.0 | 0.1 | 3.6 | ||
| Food & Beverages | 228.3 | 227.5 | 219.5 | 0.4 | 4.0 | ||
| Housing | 220.2 | 219.6 | 217.1 | 0.3 | 1.5 | ||
| Apparel | 118.8 | 120.6 | 115.2 | -1.5 | 3.1 | ||
| Transportation | 216.2 | 216.9 | 193.0 | -0.3 | 12.0 | ||
| Medical Care | 400.3 | 399.6 | 387.9 | 0.2 | 3.2 | ||
| Recreation (Dec. 1997=100) | 113.5 | 113.7 | 113.7 | -0.1 | -0.2 | ||
| Education & Communication (Dec. 1997=100) | 130.9 | 130.6 | 129.6 | 0.2 | 1.0 | ||
| Other Goods & Services | 386.5 | 386.2 | 383.2 | 0.1 | 0.8 | ||
| Producer Prices (1982 to 1984 = 100) | |||||||
| All Commodities | 204.6 | 204.0 | 184.1 | 0.3 | 11.1 | ||
| Wyoming Building Permits (New Privately Owned Housing Units Authorized) | |||||||
| Total Units | 201 | 288 | 200 | -30.2 | 0.5 | ||
| Valuation | $41,787,000 | $47,570,000 | $39,858,000 | -12.2 | 4.8 | ||
| Single Family Homes | 136 | 164 | 151 | -17.1 | -9.9 | ||
| Valuation | $37,329,000 | $38,162,000 | $36,389,000 | -2.2 | 2.6 | ||
| Casper MSA2 Building Permits | 67 | 97 | 19 | -30.9 | 252.6 | ||
| Valuation | $5,963,000 | $8,546,000 | $4,367,000 | -30.2 | 36.5 | ||
| Cheyenne MSA Building Permits | 14 | 39 | 38 | -64.1 | -63.2 | ||
| Valuation | $2,398,000 | $6,863,000 | $4,331,000 | -65.1 | -44.6 | ||
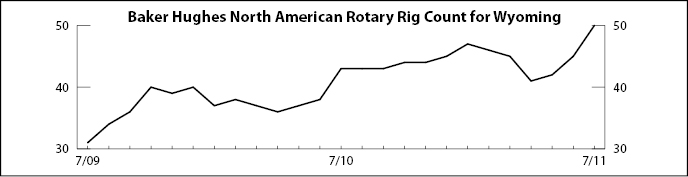
| Baker Hughes North American Rotary Rig Count for Wyoming | 50 | 45 | 43 | 11.1 | 16.3 | ||
|
|||||||
| (p) Preliminary. (r) Revised. (b) Benchmarked. | |||||||
| 1Local Area Unemployment Statistics Program estimates | |||||||
| 2Metropolitan Statistical Area | |||||||