A History of the Minimum Wage in Wyoming and the U.S. (Tables and Figure)
|
Greater than Federal Minimum Wage |
Equal to Federal Minimum Wage ($7.25) |
Less than Federal Minimum Wage |
No Minimum Wage Required |
||
|---|---|---|---|---|---|
| State | Min. Wage | State | State | Min. Wage | State |
| Alaska | $7.75 | Delaware | Arkansas | $6.25 | Alabama |
| Arizona | $7.90 | Hawaii | Georgia | $5.15 | Louisiana |
| California | $8.00 | Idaho | Minnesota | $6.15 | Mississippi |
| Colorado | $8.00 | Indiana | Wyoming | $5.15 | South Carolina |
| Connecticut | $8.70 | Iowa | Tennessee | ||
| D.C. | $8.25 | Kansas | |||
| Florida | $7.93 | Kentucky | |||
| Illinois | $8.25 | Maryland | |||
| Maine | $7.50 | North Carolina | |||
| Massachusetts | $8.00 | Nebraska | |||
| Michigan | $7.40 | New Hampshire | |||
| Missouri | $7.50 | North Dakota | |||
| Montana | $7.90 | Oklahoma | |||
| Nevada | $8.25 | Pennsylvania | |||
| New Jersey | $8.25 | South Dakota | |||
| New Mexico | $7.50 | Texas | |||
| New York | $8.00 | Utah | |||
| Ohio | $7.95 | Virginia | |||
| Oregon | $9.10 | West Virginia | |||
| Rhode Island | $8.00 | Wisconsin | |||
| Vermont | $8.73 | ||||
| Washington | $9.32 | ||||
| 21 States + D.C. | 20 States | 4 States | 5 States | ||
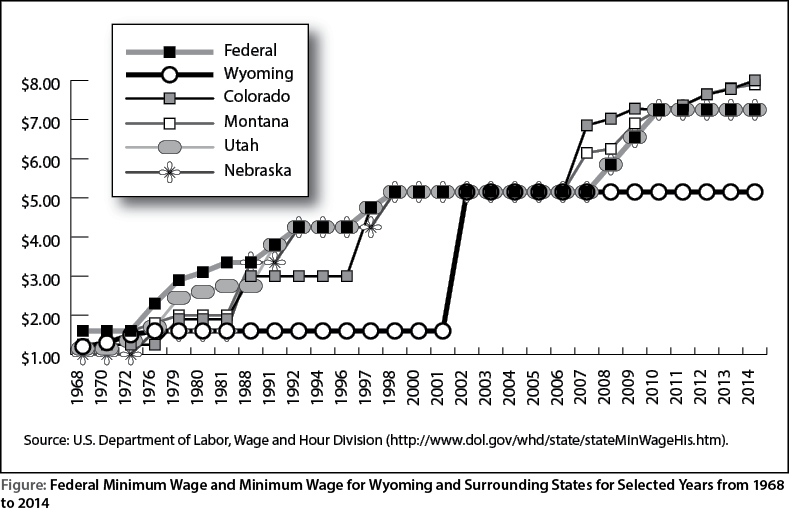
| Source: Division of Communications, Wage and Hour Division, U.S. Department of Labor. | |||||
| Year | Federal | Wyoming | Colorado | Montana |
Utah
|
Nebraska |
|---|---|---|---|---|---|---|
| 1968(a) | $1.15 & 1.60 | $1.20 | $1.00 - 1.25(b) | N/A | $1.00 -$1.15 (b) | $1.00 |
| 1970(a) | 1.30 & 1.60 | 1.30 | 1.00 - 1.25(b) | N/A | 1.00 -1.15 (b) | 1.00 |
| 1972 | 1.60 | 1.50 | 1.00 - 1.25(b) | $1.60 | 1.20 -1.35 (b) | 1.00 |
| 1976(a) | 2.20 & 2.30 | 1.60 | 1.00 - 1.25(b) | 1.80 | 1.55 -1.70 (b) | 1.60 |
| 1979 | 2.90 | 1.60 | 1.90 | 2.00 | 2.20 -2.45 (b) | 1.60 |
| 1980 | 3.10 | 1.60 | 1.90 | 2.00 | 2.35 -2.60 (b) | 1.60 |
| 1981 | 3.35 | 1.60 | 1.90 | 2.00 | 2.50 -2.75 (b) | 1.60 |
| 1988 | 3.35 | 1.60 | 3.00 | 3.35 | 2.50 -2.75 (b) | 3.35 |
| 1991 | 3.80 | 1.60 | 3.00 | 3.80 | 3.80 | 3.35 |
| 1992 | 4.25 | 1.60 | 3.00 | 4.25(d) | 4.25 | 4.25 |
| 1994 | 4.25 | 1.60 | 3.00 | 4.25(d) | 4.25 | 4.25 |
| 1996 | 4.25 | 1.60 | 3.00 | 4.25(d) | 4.25 | 4.25 [c] |
| 1997 | 4.75 | 1.60 | 4.75 | 4.75(d) | 4.75 | 4.25 [c] |
| 1998 | 5.15 | 1.60 | 5.15 | 5.15(d) | 5.15 | 5.15 [c] |
| 2000 | 5.15 | 1.60 | 5.15 | 4.00 - 5.15 (d) | 5.15 | 5.15 [c] |
| 2001 | 5.15 | 1.60 | 5.15 | 4.00 - 5.15 (d) | 5.15 | 5.15 [c] |
| 2002 | 5.15 | 5.15 | 5.15 | 4.00 - 5.15 (d) | 5.15 | 5.15 [c] |
| 2003 | 5.15 | 5.15 | 5.15 | 4.00 - 5.15 (d) | 5.15 | 5.15 [c] |
| 2004 | 5.15 | 5.15 | 5.15 | 4.00 - 5.15 (d) | 5.15 | 5.15 [c] |
| 2005 | 5.15 | 5.15 | 5.15 | 4.00 - 5.15 (d) | 5.15 | 5.15 [c] |
| 2006 | 5.15 | 5.15 | 5.15 | 4.00 - 5.15 (d) | 5.15 | 5.15 [c] |
| 2007 | 5.15 | 5.15 | 6.85 | 4.00 - 6.15 (d) | 5.15 | 5.15 [c] |
| 2008 | 5.85 | 5.15 | 7.02 | 4.00 - 6.25 (d) | 5.85 | 5.85 [c] |
| 2009 | 6.55 | 5.15 | 7.28 | 4.00 - 6.90 (d) | 6.55 | 6.55 [c] |
| 2010 | 7.25 | 5.15 | 7.24 | 4.00 - 7.25 (d) | 7.25 | 7.25 [c] |
| 2011 | 7.25 | 5.15 | 7.36 | 4.00 - 7.35 (d) | 7.25 | 7.25 [c] |
| 2012 | 7.25 | 5.15 | 7.64 | 4.00 - 7.65 (d) | 7.25 | 7.25 [c] |
| 2013 | 7.25 | 5.15 | 7.78 | 4.00 - 7.80 (d) | 7.25 | 7.25 [c] |
| 2014 | 7.25 | 5.15 | 8.00 | 4.00 - 7.90 (d) | 7.25 | 7.25 [c] |
|
Sources:
1) Wage data for the years 1968 through 1998 were obtained from the Book of the States, 1968-1999 edition, volume 32 which was published by the Council of State Governments.
2) Wage data for the years 2000 through the present were obtained from the U.S. Department of Labor, Office of State Standards Programs Wage and Hour Division web site. Minimum Wage and Overtime Pay Standards Applicable to Nonsupervisory NONFARM Private Sector Employment Under State and Federal Laws. N/A = Not applicable. (a) Under the Federal Fair Labor Standards Act (FLSA), the two rates shown in 1968, 1970, and 1976 reflect the former multiple-track minimum-wage system in effect from 1961 to 1978. (b) For the years indicated, the laws in Colorado applied only to women and minors. (c) Rates applicable to employers of four or more. (d) Montana sets a lower rate for businesses with gross annual sales of $110,000 or less ($4.00 - January 1, 1992-January 1, 2005). Prepared by: Office of Communications, Wage and Hour Division, U.S. Department of Labor. http://www.dol.gov/whd/state/stateMinWageHis.htm This document was last revised in March 2014; unless otherwise stated, the information reflects requirements that were in effect, or would take effect, as of January 1, 2014. |
||||||