
Examining the Demographics of New Hires
(Tables and Figures)
See related article
Tables 1, 2, 3, 4, 5
Figure 1, 2, 3, 4, 5
| Total | Females | Males | Non-Residents | |||||
|---|---|---|---|---|---|---|---|---|
| N | Col % | N | Col % | N | Col % | N | Col % | |
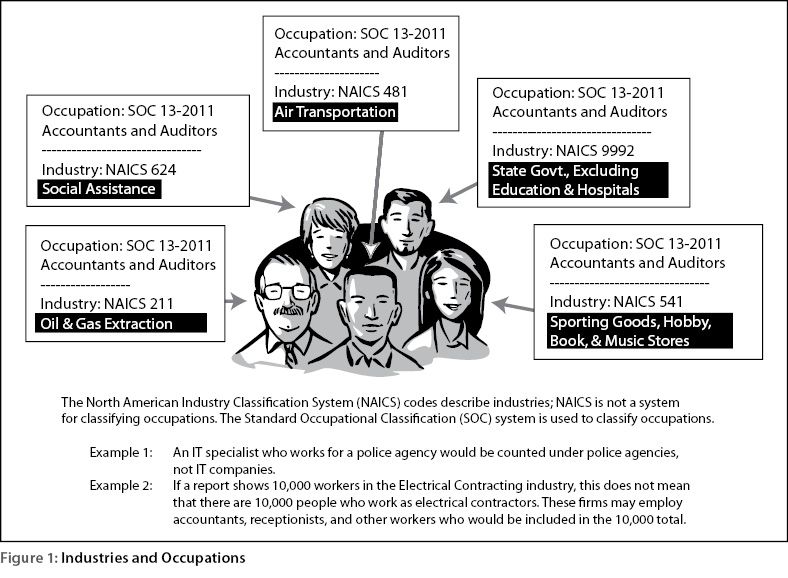
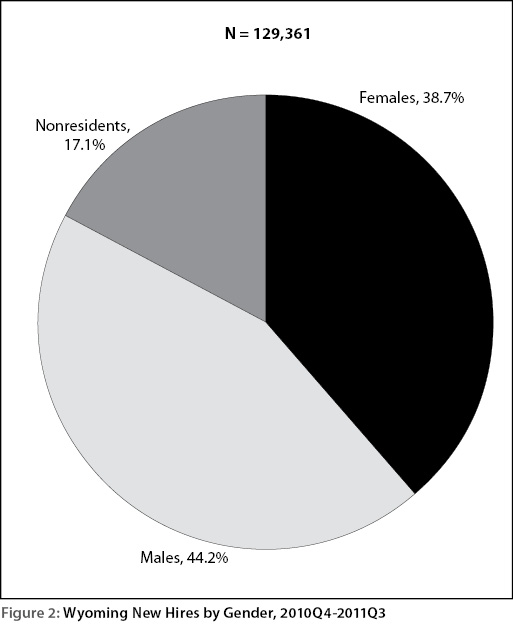
| Total | 129,361 | 100.0% | 50,049 | 100.0% | 57,150 | 100.0% | 22,162 | 100.0% |
| Goods-Producing | 30,525 | 23.6% | 3,229 | 6.5% | 20,667 | 36.2% | 6,630 | 29.9% |
| Natural Resources & Mining | 12,579 | 9.7% | 1,215 | 2.4% | 8,832 | 15.5% | 2,533 | 11.4% |
| Sector 11 (Agriculture, Forestry, Fishing & Hunting) | 1,107 | 0.9% | 172 | 0.3% | 643 | 1.1% | 293 | 1.3% |
| Sector 21 (Mining) | 11,472 | 8.9% | 1,043 | 2.1% | 8,189 | 14.3% | 2,240 | 10.1% |
| Construction | 14,243 | 11.0% | 1,066 | 2.1% | 9,592 | 16.8% | 3,585 | 16.2% |
| Sector 23 (Construction) | 14,243 | 11.0% | 1,066 | 2.1% | 9,592 | 16.8% | 3,585 | 16.2% |
| Manufacturing | 3,703 | 2.9% | 948 | 1.9% | 2,243 | 3.9% | 512 | 2.3% |
| Sector 31-33 (Manufacturing) | 3,703 | 2.9% | 948 | 1.9% | 2,243 | 3.9% | 512 | 2.3% |
| Service-Providing | 90,880 | 70.3% | 43,404 | 86.7% | 32,815 | 57.4% | 14,664 | 66.2% |
| Trade, Transportation, & Utilities | 27,257 | 21.1% | 9,896 | 19.8% | 12,566 | 22.0% | 4,798 | 21.6% |
| Sector 42 (Wholesale Trade) | 3,470 | 2.7% | 700 | 1.4% | 2,285 | 4.0% | 486 | 2.2% |
| Sector 44-45 (Retail Trade) | 19,156 | 14.8% | 8,555 | 17.1% | 7,005 | 12.3% | 3,596 | 16.2% |
| Sector 48-49 (Transportation & Warehousing) | 4,340 | 3.4% | 595 | 1.2% | 3,081 | 5.4% | 666 | 3.0% |
| Sector 22 (Utilities) | 291 | 0.2% | 46 | 0.1% | 195 | 0.3% | 50 | 0.2% |
| Information | 1,388 | 1.1% | 652 | 1.3% | 602 | 1.1% | 135 | 0.6% |
| Sector 51 (Information) | 1,388 | 1.1% | 652 | 1.3% | 602 | 1.1% | 135 | 0.6% |
| Financial activities | 3,829 | 3.0% | 2,008 | 4.0% | 1,347 | 2.4% | 474 | 2.1% |
| Sector 52 (Finance & Insurance) | 1,816 | 1.4% | 1,330 | 2.7% | 321 | 0.6% | 165 | 0.7% |
| Sector 53 (Real Estate & Rental & Leasing) | 2,013 | 1.6% | 678 | 1.4% | 1,026 | 1.8% | 309 | 1.4% |
| Professional & Business Services | 10,859 | 8.4% | 3,845 | 7.7% | 5,541 | 9.7% | 1,473 | 6.6% |
| Sector 54 (Professional, Scientific, & Technical Services) | 3,507 | 2.7% | 1,631 | 3.3% | 1,212 | 2.1% | 664 | 3.0% |
| Sector 55 (Management of Companies & Enterprises) | 84 | 0.1% | 29 | 0.1% | 32 | 0.1% | 23 | 0.1% |
| Sector 56 (Administrative & Support & Waste Management & Remediation Services) | 7,268 | 5.6% | 2,185 | 4.4% | 4,297 | 7.5% | 786 | 3.5% |
| Educational & Health Services | 19,005 | 14.7% | 13,062 | 26.1% | 3,711 | 6.5% | 2,232 | 10.1% |
| Sector 61 (Educational Services) | 6,772 | 5.2% | 3,991 | 8.0% | 1,880 | 3.3% | 901 | 4.1% |
| Sector 62 (Health Care & Social Assistance) | 12,233 | 9.5% | 9,071 | 18.1% | 1,831 | 3.2% | 1,331 | 6.0% |
| Leisure & Hospitality | 28,542 | 22.1% | 13,941 | 27.9% | 9,048 | 15.8% | 5,552 | 25.1% |
| Sector 71 (Arts, Entertainment, & Recreation) | 2,298 | 1.8% | 946 | 1.9% | 863 | 1.5% | 489 | 2.2% |
| Sector 72 (Accommodation & Food Services) | 26,244 | 20.3% | 12,995 | 26.0% | 8,185 | 14.3% | 5,063 | 22.8% |
| Other Services | 4,490 | 3.5% | 1,719 | 3.4% | 2,245 | 3.9% | 526 | 2.4% |
| Sector 81 (Other Services, Except Public Administration) | 4,490 | 3.5% | 1,719 | 3.4% | 2,245 | 3.9% | 526 | 2.4% |
| Public Administration | 3,165 | 2.4% | 1,609 | 3.2% | 1,424 | 2.5% | 132 | 0.6% |
| Sector 92 (Public Administration) | 3,165 | 2.4% | 1,609 | 3.2% | 1,424 | 2.5% | 132 | 0.6% |
| Unclassified | 301 | 0.2% | 89 | 0.2% | 0 | 0.0% | 212 | 1.0% |
| Sector 99 (Unclassified) | 301 | 0.2% | 89 | 0.2% | 0 | 0.0% | 212 | 1.0% |
| Females | |||||
|---|---|---|---|---|---|
| Rank |
SOC Code |
Occupation | N |
Column % |
Average Hourly Wage |
| 1 | 43-9061 | Office Clerks, General | 3,168 | 6.3% | $12.00 |
| 2 | 41-2031 | Retail Salespersons | 2,878 | 5.8% | $8.00 |
| 3 | 37-2012 | Maids & Housekeeping Cleaners | 2,785 | 5.6% | $8.25 |
| 4 | 41-2011 | Cashiers | 2,498 | 5.0% | $8.50 |
| 5 | 35-3031 | Waiters & Waitresses | 1,988 | 4.0% | $5.75 |
| 6 | 35-3021 | Combined Food Prep. & Serving Workers, Incl. Fast Food | 1,800 | 3.6% | $8.00 |
| 7 | 35-3011 | Bartenders | 1,483 | 3.0% | $7.25 |
| 8 | 39-9011 | Child Care Workers | 1,265 | 2.5% | $8.09 |
| 9 | 35-9021 | Dishwashers | 1,137 | 2.3% | $8.00 |
| 10 | 35-3022 | Counter Attendants, Cafeteria, Concession, & Coffee Shop | 1,105 | 2.2% | $7.25 |
| Total, All Occupations | 50,049 | 100.0% | $10.00 | ||
| Males | |||||
| Rank | SOC Code | Occupation | N |
Column % |
Average Hourly Wage |
| 1 | 53-3032 | Truck Drivers, Heavy & Tractor-Trailer | 4,298 | 7.5% | $17.37 |
| 2 | 47-5071 | Roustabouts, Oil & Gas | 2,519 | 4.4% | $15.00 |
| 3 | 47-2061 | Construction Laborers | 2,288 | 4.0% | $12.00 |
| 4 | 37-3011 | Landscaping & Groundskeeping Workers | 1,534 | 2.7% | $10.00 |
| 5 | 41-2031 | Retail Salespersons | 1,490 | 2.6% | $9.00 |
| 6 | 41-2011 | Cashiers | 1,387 | 2.4% | $8.50 |
| 7 | 47-2073 | Operating Engineers & Other Const. Equipment Operators | 1,268 | 2.2% | $18.00 |
| 8 | 35-9021 | Dishwashers | 1,239 | 2.2% | $8.00 |
| 9 | 43-9061 | Office Clerks, General | 1,231 | 2.2% | $12.50 |
| 10 | 53-7062 | Laborers & Freight, Stock, & Material Movers, Hand | 1,185 | 2.1% | $11.45 |
| Total, All Occupations | 57,150 | 100.0% | $13.00 | ||
| Non-residents | |||||
| Rank | SOC Code | Occupation | N |
Column % |
Average Hourly Wage |
| 1 | 37-2012 | Maids & Housekeeping Cleaners | 1,139 | 5.1% | $8.50 |
| 2 | 53-3032 | Truck Drivers, Heavy & Tractor-Trailer | 969 | 4.4% | $18.00 |
| 3 | 35-9021 | Dishwashers | 935 | 4.2% | $8.50 |
| 4 | 41-2011 | Cashiers | 754 | 3.4% | $8.50 |
| 5 | 41-2031 | Retail Salespersons | 701 | 3.2% | $9.00 |
| 6 | 47-5071 | Roustabouts, Oil & Gas | 552 | 2.5% | $15.00 |
| 7 | 47-2061 | Construction Laborers | 520 | 2.3% | $15.00 |
| 8 | 35-3021 | Combined Food Preparation & Serving Workers, Incl. Fast Food | 506 | 2.3% | $7.75 |
| 9 | 47-2073 | Operating Engineers & Other Const. Equipment Operators | 497 | 2.2% | $19.00 |
| 10 | 35-2014 | Cooks, Restaurant | 484 | 2.2% | $8.25 |
| Total, All Occupations | 22,162 | 100.0% | $13.00 | ||
| Females | |||||
|---|---|---|---|---|---|
| Rank |
SOC Code |
Occupation | N |
Column % |
Educational Requirement |
| 1 | 29-1141 | Registered Nurses | 836 | 1.7% | Associate's Degree |
| 2 | 11-1021 | General & Operations Managers | 231 | 0.5% | Bachelor's Degree |
| 3 | 25-3099 | Teachers & Instructors, All Other | 207 | 0.4% | Bachelor's Degree |
| 4 | 39-9031 | Fitness Trainers & Aerobics Instructors | 140 | 0.3% | Vocational Training |
| 5 | 25-2011 | Preschool Teachers, Except Special Education | 135 | 0.3% | Vocational Training |
| Subtotal, All Occupations Requiring More than a High School Diploma | 5,000 | 10.0% | |||
| Total | 50,049 | 100.0% | |||
| Males | |||||
| Rank |
SOC Code |
Occupation | N |
Column % |
Educational Requirement |
| 1 | 51-4121 | Welders, Cutters, Solderers, & Brazers | 1,161 | 2.0% | Vocational Training |
| 2 | 49-3023 | Automotive Service Technicians & Mechanics | 558 | 1.0% | Vocational Training |
| 3 | 11-1021 | General & Operations Managers | 338 | 0.6% | Bachelor's Degree |
| 4 | 19-4041 | Geological & Petroleum Technicians | 232 | 0.4% | Associate's Degree |
| 5 | 17-2051 | Civil Engineers | 205 | 0.4% | Bachelor's Degree |
| Subtotal, All Occupations Requiring More than a High School Diploma | 5,844 | 10.2% | |||
| Total | 57,150 | 100.0% | |||
| Non-residents | |||||
| Rank |
SOC Code |
Occupation | N |
Column % |
Educational Requirement |
| 1 | 51-4121 | Welders, Cutters, Solderers, & Brazers | 474 | 2.1% | Vocational Training |
| 2 | 29-9011 | Occupational Health & Safety Specialists | 164 | 0.7% | Bachelor's Degree |
| 3 | 17-2199 | Engineers, All Other | 119 | 0.5% | Bachelor's Degree |
| 4 | 11-1011 | Chief Executives | 118 | 0.5% | Bachelor's Degree |
| 5 | 11-1021 | General & Operations Managers | 114 | 0.5% | Bachelor's Degree |
| Subtotal, All Occupations Requiring More than a High School Diploma | 2,565 | 11.6% | |||
| Total | 22,162 | 100.0% | |||
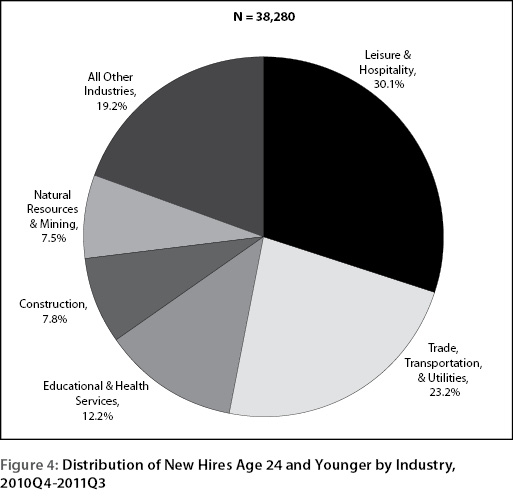
| Younger Workers (Under Age 25) | ||||
|---|---|---|---|---|
| Rank | SOC Code | Occupation | N | Column % |
| 1 | 41-2031 | Retail Salespersons | 2,278 | 6.0% |
| 2 | 41-2011 | Cashiers | 1,990 | 5.2% |
| 3 | 35-3021 | Combined Food Preparation & Serving Workers, Including Fast Food | 1,628 | 4.3% |
| 4 | 35-9021 | Dishwashers | 1,469 | 3.8% |
| 5 | 37-2012 | Maids & Housekeeping Cleaners | 1,436 | 3.8% |
| 6 | 35-3031 | Waiters & Waitresses | 1,275 | 3.3% |
| 7 | 43-9061 | Office Clerks, General | 1,169 | 3.1% |
| 8 | 37-3011 | Landscaping & Groundskeeping Workers | 1,154 | 3.0% |
| 9 | 47-5071 | Roustabouts, Oil & Gas | 1,139 | 3.0% |
| 10 | 37-2011 | Janitors & Cleaners, Except Maids & Housekeeping Cleaners | 978 | 2.6% |
| Total, All Occupations | 38,280 | 100.0% | ||
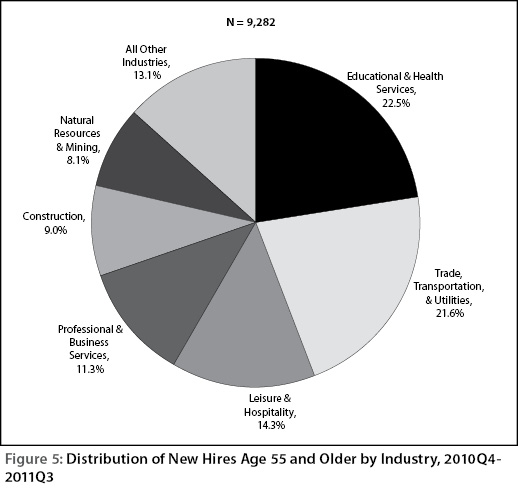
| Older Workers (Age 55 and Older) | ||||
| Rank | SOC Code | Occupation | N | Column % |
| 1 | 53-3032 | Truck Drivers, Heavy & Tractor-Trailer | 577 | 6.2% |
| 2 | 43-9061 | Office Clerks, General | 436 | 4.7% |
| 3 | 41-2011 | Cashiers | 415 | 4.5% |
| 4 | 41-2031 | Retail Salespersons | 271 | 2.9% |
| 5 | 43-4081 | Hotel, Motel, & Resort Desk Clerks | 253 | 2.7% |
| 6 | 47-2031 | Carpenters | 218 | 2.3% |
| 7 | 37-2011 | Housekeeping Cleaners | 208 | 2.2% |
| 8 | 43-3031 | Bookkeeping, Accounting, & Auditing Clerks | 194 | 2.1% |
| 9 | 25-3098 | Substitute Teachers | 180 | 1.9% |
| 10 | 51-4121 | Welders, Cutters, Solderers, & Brazers | 172 | 1.9% |
| Total, All Occupations | 9,282 | 100.0% | ||
| Younger Workers (Under Age 25) | |||||
|---|---|---|---|---|---|
| Rank |
SOC Code |
Occupation | N |
Column % |
Educational Requirement |
| 1 | 51-4121 | Welders, Cutters, Solderers, & Brazers | 250 | 0.7% | Vocational Training |
| 2 | 29-1141 | Registered Nurses | 180 | 0.5% | Associate's Degree |
| 3 | 49-3023 | Automotive Service Technicians & Mechanics | 175 | 0.5% | Vocational Training |
| 4 | 25-2011 | Preschool Teachers, Except Special Education | 109 | 0.3% | Vocational Training |
| 5 | 25-3099 | Teachers & Instructors, All Other | 103 | 0.3% | Bachelor's Degree |
| Subtotal, All Occupations Requiring More than a High School Diploma | 2,172 | 5.7% | |||
| Total, All Occupations | 38,280 | 100.0% | |||
| Older Workers (Age 55 and Older) | |||||
| Rank |
SOC Code |
Occupation | N |
Column % |
Educational Requirement |
| 1 | 51-4121 | Welders, Cutters, Solderers, & Brazers | 172 | 1.6% | Vocational Training |
| 2 | 11-1021 | General & Operations Managers | 113 | 1.0% | Bachelor's Degree |
| 3 | 29-1141 | Registered Nurses | 83 | 0.8% | Associate's Degree |
| 4 | 25-1194 | Vocational Education Teachers, Postsecondary | 69 | 0.6% | Bachelor's Degree |
| 5 | 49-3023 | Automotive Service Technicians & Mechanics | 53 | 0.5% | Vocational Training |
| Subtotal, All Occupations Requiring More than a High School Diploma | 1,206 | 11.0% | |||
| Total, All Occupations | 10,992 | 100.0% | |||