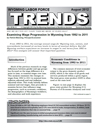
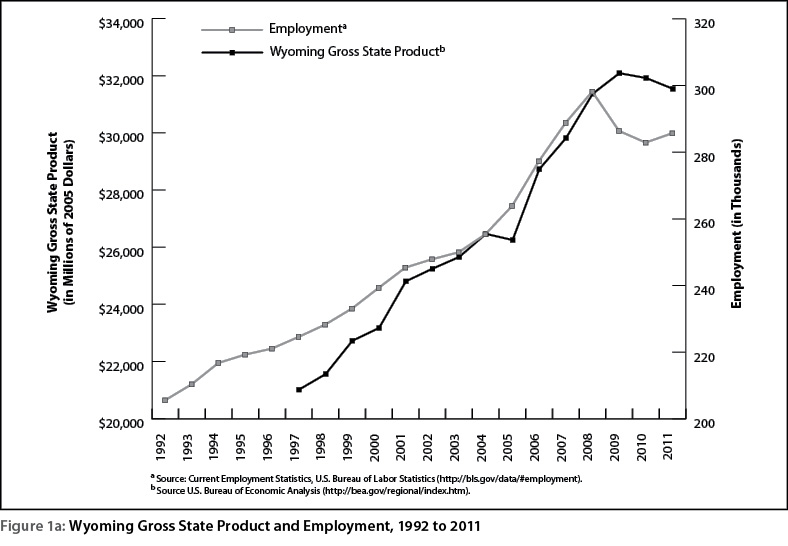
Examining Wage Progression in Wyoming
from 1992 to 2011
See Related Article
Figures 1a, 1b, 2, 3, 4, 5, 6a, 6b, 7, 8a, 8b, 9
|
Year |
Base |
Base |
|---|---|---|
|
1982 |
96.5 |
68.8 |
|
1983 |
99.6 |
71.0 |
|
1984 |
103.9 |
74.1 |
|
1985 |
107.6 |
76.7 |
|
1986 |
109.6 |
78.1 |
|
1987 |
113.6 |
81.0 |
|
1988 |
118.3 |
84.3 |
|
1989 |
124.0 |
88.4 |
|
1990 |
130.7 |
93.2 |
|
1991 |
136.2 |
97.1 |
|
1992 |
140.3 |
100.0 |
|
1993 |
144.5 |
103.0 |
|
1994 |
148.2 |
105.6 |
|
1995 |
152.4 |
108.6 |
|
1996 |
156.9 |
111.8 |
|
1997 |
160.5 |
114.4 |
|
1998 |
163.0 |
116.2 |
|
1999 |
166.6 |
118.7 |
|
2000 |
172.2 |
122.7 |
|
2001 |
177.1 |
126.2 |
|
2002 |
179.9 |
128.2 |
|
2003 |
184.0 |
131.1 |
|
2004 |
188.9 |
134.6 |
|
2005 |
195.3 |
139.2 |
|
2006 |
201.6 |
143.7 |
|
2007 |
207.3 |
147.8 |
|
2008 |
215.3 |
153.5 |
|
2009 |
214.5 |
152.9 |
|
2010 |
218.1 |
155.4 |
|
2011 |
224.9 |
160.3 |
|
Source: Consumer Price Index, |
||
| Industry Sector | Employment | Quarters of Experience | ||
|---|---|---|---|---|
| Average | Median | Mode | ||
| Total, All Industries | 427,450 | 20.4 | 11.0 | 1.0 |
| Natural Resources & Mining | 42,663 | 22.9 | 15.0 | 1.0 |
| Construction | 43,952 | 16.3 | 8.0 | 1.0 |
| Manufacturing | 14,764 | 23.1 | 13.0 | 1.0 |
| Wholesale Trade, Transportation, & Utilities | 29,102 | 22.6 | 14.0 | 1.0 |
| Retail Trade | 51,317 | 17.3 | 9.0 | 2.0 |
| Information | 6,159 | 22.2 | 13.0 | 2.0 |
| Financial Activities | 14,673 | 22.8 | 14.0 | 1.0 |
| Professional & Business Services | 35,741 | 13.3 | 6.0 | 1.0 |
| Educational Services | 39,481 | 31.5 | 22.0 | 80.0 |
| Health Care & Social Assistance | 40,506 | 24.7 | 16.0 | 2.0 |
| Leisure & Hospitality | 64,954 | 13.4 | 8.0 | 2.0 |
| Other Services, Except Public Administration | 14,350 | 14.3 | 6.0 | 1.0 |
| Public Administration | 28,741 | 29.9 | 21.0 | 80.0 |
| Nonclassified Industry | 1,047 | 3.8 | 3.0 | 1.0 |
| Source: Wage Records Database. Research & Planning, Wyoming Department of Workforce Services. | ||||
| Note: Data series began in 1992 — no data available before that year. | ||||
| Industry Sector |
Number of Jobs |
Percentage of Jobs Requiring: |
|
|---|---|---|---|
|
High School Diploma or Less |
More than High School |
||
| Educational Services | 25,858 | 22.5% | 77.5% |
| Health Care & Social Assistance | 22,569 | 36.8% | 63.2% |
| Public Administration | 27,172 | 37.2% | 62.8% |
| Information | 3,644 | 39.1% | 60.9% |
| Professional & Business Services | 16,867 | 40.9% | 59.1% |
| Financial Activities | 10,625 | 44.9% | 55.1% |
| Other Services, Except Public Admin. | 7,472 | 47.2% | 52.8% |
| Construction | 21,689 | 55.4% | 44.6% |
| Manufacturing | 8,682 | 57.4% | 42.6% |
| Natural Resources & Mining | 25,707 | 58.8% | 41.2% |
| Trade, Transportation, & Utilities | 55,299 | 65.6% | 34.4% |
| Leisure & Hospitality | 30,184 | 78.0% | 22.0% |
| Total | 255,768 | 51.9% | 48.1% |
| Source: O*NET Online (http://www.onetonline.org/). | |||
| Industry Sector | Nominal | Real | ||||||
|---|---|---|---|---|---|---|---|---|
| 1992 | 2011 | Difference |
% Change per Year |
1992 | 2011 | Difference |
% Change per Year |
|
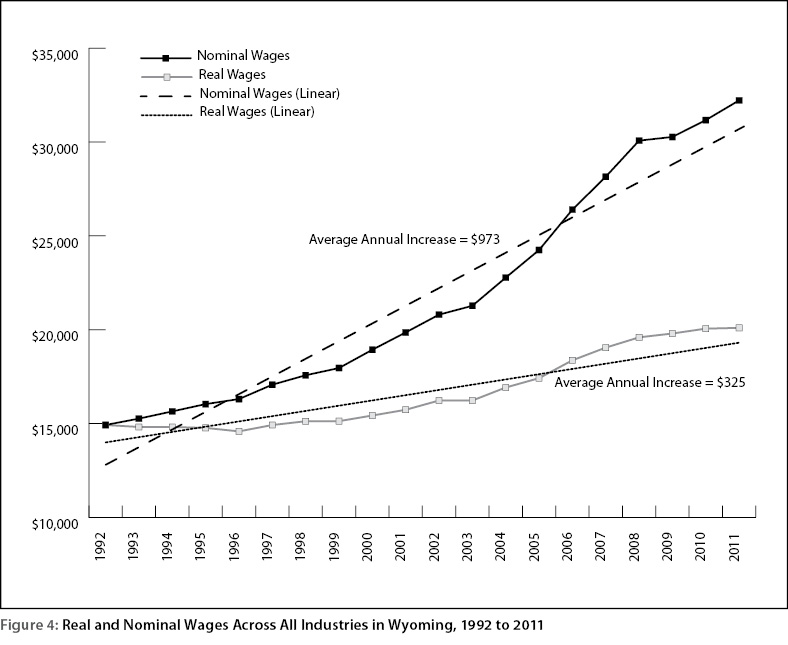
| Total, All Industries | $14,923 | $32,219 | $17,297 | 5.8% | $14,923 | $20,096 | $5,173 | 1.7% |
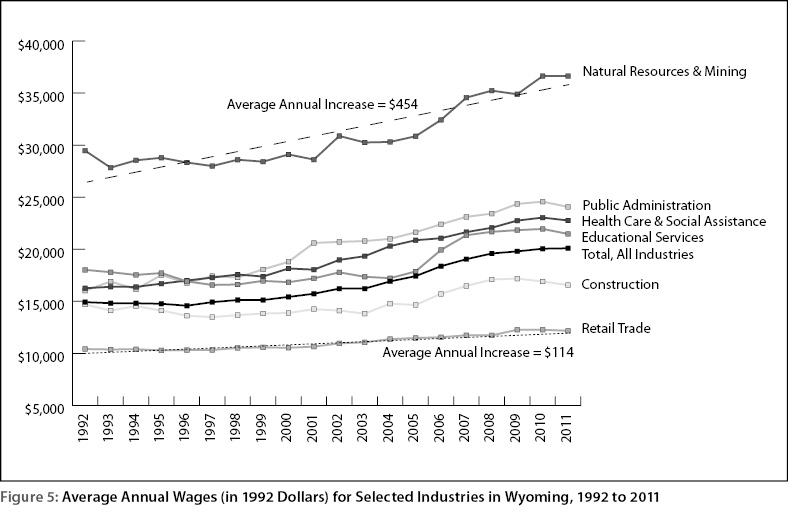
| Natural Resources & Mining | $29,470 | $58,732 | $29,262 | 5.0% | $29,470 | $36,633 | $7,163 | 1.2% |
| Construction | $14,695 | $26,548 | $11,853 | 4.0% | $14,695 | $16,559 | $1,864 | 0.6% |
| Manufacturing | $19,134 | $43,590 | $24,456 | 6.4% | $19,134 | $27,188 | $8,054 | 2.1% |
| Wholesale Trade, Transp., & Utilities | $25,649 | $45,393 | $19,744 | 3.8% | $25,649 | $28,313 | $2,664 | 0.5% |
| Retail Trade | $10,417 | $19,513 | $9,096 | 4.4% | $10,417 | $12,171 | $1,754 | 0.8% |
| Information | $17,072 | $33,151 | $16,079 | 4.7% | $17,072 | $20,677 | $3,605 | 1.1% |
| Financial Activities | $17,824 | $38,973 | $21,149 | 5.9% | $17,824 | $24,308 | $6,484 | 1.8% |
| Professional & Business Services | $13,719 | $29,801 | $16,082 | 5.9% | $13,719 | $18,587 | $4,868 | 1.8% |
| Educational Services | $18,024 | $34,429 | $16,405 | 4.6% | $18,024 | $21,474 | $3,450 | 1.0% |
| Health Care & Social Assistance | $16,252 | $36,498 | $20,246 | 6.2% | $16,252 | $22,765 | $6,513 | 2.0% |
| Leisure & Hospitality | $4,741 | $10,926 | $6,185 | 6.5% | $4,741 | $6,815 | $2,074 | 2.2% |
| Other Services, Except Public Admin. | $11,490 | $25,512 | $14,022 | 6.1% | $11,490 | $15,912 | $4,422 | 1.9% |
| Public Administration | $16,022 | $38,595 | $22,573 | 7.0% | $16,022 | $24,072 | $8,050 | 2.5% |
| Nonclassified Industry | $12,664 | $17,427 | $4,763 | 1.9% | $12,664 | $10,869 | -$1,795 | -0.7% |
| Source: Wage Records database. Research & Planning, Wyoming Department of Workforce Services. | ||||||||
| 1992-2004 (Relatively Stable Period) | ||||||||
|---|---|---|---|---|---|---|---|---|
| Industry Sector | Nominal | Real | ||||||
| 1992 | 2004 | Difference |
% Change per Year |
1992 | 2004 | Difference |
% Change per Year |
|
| Total, All Industries | $14,923 | $22,774 | $7,852 | 4.0% | $14,923 | $16,915 | $1,992 | 1.0% |
| Natural Resources & Mining | $29,470 | $40,812 | $11,342 | 3.0% | $29,470 | $30,312 | $842 | 0.2% |
| Construction | $14,695 | $19,896 | $5,201 | 2.7% | $14,695 | $14,777 | $82 | 0.0% |
| Manufacturing | $19,134 | $30,888 | $11,754 | 4.7% | $19,134 | $22,941 | $3,807 | 1.5% |
| Wholesale Trade, Transp., & Utilities | $25,649 | $33,233 | $7,584 | 2.3% | $25,649 | $24,683 | -$966 | -0.3% |
| Retail Trade | $10,417 | $15,303 | $4,885 | 3.6% | $10,417 | $11,366 | $948 | 0.7% |
| Information | $17,072 | $24,460 | $7,388 | 3.3% | $17,072 | $18,167 | $1,095 | 0.5% |
| Financial Activities | $17,824 | $28,276 | $10,452 | 4.5% | $17,824 | $21,001 | $3,177 | 1.4% |
| Professional & Business Services | $13,719 | $20,988 | $7,270 | 4.1% | $13,719 | $15,588 | $1,870 | 1.0% |
| Educational Services | $18,024 | $23,189 | $5,165 | 2.2% | $18,024 | $17,223 | -$801 | -0.3% |
| Health Care & Social Assistance | $16,252 | $27,339 | $11,086 | 5.2% | $16,252 | $20,305 | $4,053 | 1.9% |
| Leisure & Hospitality | $4,741 | $7,820 | $3,079 | 5.0% | $4,741 | $5,808 | $1,067 | 1.7% |
| Other Services, Except Public Admin. | $11,490 | $16,998 | $5,507 | 3.7% | $11,490 | $12,625 | $1,134 | 0.8% |
| Public Administration | $16,022 | $28,274 | $12,252 | 5.9% | $16,022 | $21,000 | $4,978 | 2.4% |
| 2005-2008 (Period of Economic Growth) | ||||||||
| Industry Sector | Nominal | Real | ||||||
| 2005 | 2008 | Difference |
% Change per Year |
2005 | 2008 | Difference |
% Change per Year |
|
| Total, All Industries | $24,246 | $30,075 | $5,829 | 6.0% | $17,418 | $19,598 | $2,180 | 3.1% |
| Natural Resources & Mining | $42,951 | $54,072 | $11,121 | 6.5% | $30,855 | $35,235 | $4,380 | 3.5% |
| Construction | $20,398 | $26,237 | $5,839 | 7.2% | $14,654 | $17,097 | $2,444 | 4.2% |
| Manufacturing | $32,267 | $39,209 | $6,942 | 5.4% | $23,180 | $25,550 | $2,370 | 2.6% |
| Wholesale Trade, Transp., & Utilities | $35,293 | $43,022 | $7,729 | 5.5% | $25,354 | $28,035 | $2,681 | 2.6% |
| Retail Trade | $15,978 | $17,999 | $2,020 | 3.2% | $11,479 | $11,729 | $250 | 0.5% |
| Information | $24,593 | $28,733 | $4,140 | 4.2% | $17,667 | $18,723 | $1,057 | 1.5% |
| Financial Activities | $30,259 | $38,345 | $8,086 | 6.7% | $21,737 | $24,987 | $3,250 | 3.7% |
| Professional & Business Services | $22,981 | $28,498 | $5,517 | 6.0% | $16,509 | $18,570 | $2,061 | 3.1% |
| Educational Services | $24,875 | $33,270 | $8,395 | 8.4% | $17,870 | $21,680 | $3,810 | 5.3% |
| Health Care & Social Assistance | $29,049 | $33,863 | $4,814 | 4.1% | $20,868 | $22,067 | $1,198 | 1.4% |
| Leisure & Hospitality | $8,355 | $10,232 | $1,877 | 5.6% | $6,002 | $6,667 | $666 | 2.8% |
| Other Services, Except Public Admin. | $18,527 | $24,897 | $6,370 | 8.6% | $13,310 | $16,224 | $2,914 | 5.5% |
| Public Administration | $30,113 | $35,954 | $5,841 | 4.8% | $21,632 | $23,429 | $1,796 | 2.1% |
| 2009-2011 (Economic Downturn and Recovery) | ||||||||
| Industry Sector | Nominal | Real | ||||||
| 2009 | 2011 | Difference |
% Change per Year |
2009 | 2011 | Difference |
% Change per Year |
|
| Total, All Industries | $30,271 | $32,219 | $1,949 | 2.1% | $19,796 | $20,096 | $300 | 0.5% |
| Natural Resources & Mining | $53,352 | $58,732 | $5,380 | 3.4% | $34,891 | $36,633 | $1,742 | 1.7% |
| Construction | $26,273 | $26,548 | $276 | 0.3% | $17,181 | $16,559 | -$623 | -1.2% |
| Manufacturing | $40,204 | $43,590 | $3,386 | 2.8% | $26,292 | $27,188 | $896 | 1.1% |
| Wholesale Trade, Transp., & Utilities | $42,937 | $45,393 | $2,456 | 1.9% | $28,079 | $28,313 | $233 | 0.3% |
| Retail Trade | $18,763 | $19,513 | $750 | 1.3% | $12,270 | $12,171 | -$99 | -0.3% |
| Information | $29,617 | $33,151 | $3,535 | 4.0% | $19,368 | $20,677 | $1,309 | 2.3% |
| Financial Activities | $36,172 | $38,973 | $2,800 | 2.6% | $23,656 | $24,308 | $653 | 0.9% |
| Professional & Business Services | $28,936 | $29,801 | $865 | 1.0% | $18,923 | $18,587 | -$336 | -0.6% |
| Educational Services | $33,390 | $34,429 | $1,039 | 1.0% | $21,836 | $21,474 | -$362 | -0.6% |
| Health Care & Social Assistance | $34,794 | $36,498 | $1,704 | 1.6% | $22,754 | $22,765 | $11 | 0.0% |
| Leisure & Hospitality | $10,413 | $10,926 | $513 | 1.6% | $6,810 | $6,815 | $5 | 0.0% |
| Other Services, Except Public Admin. | $24,215 | $25,512 | $1,296 | 1.8% | $15,836 | $15,912 | $76 | 0.2% |
| Public Administration | $37,248 | $38,595 | $1,347 | 1.2% | $24,359 | $24,072 | -$286 | -0.4% |
| Source: Wage Records database. Research & Planning, Wyoming Department of Workforce Services. | ||||||||