
Local Jobs and Payroll in Wyoming in Fourth Quarter 2014: Slight Slowdown in Payroll and Job Growth
See Related Tables and Figures
The purpose of this article is to illustrate and describe employment and payroll changes between fourth quarter 2013 and fourth quarter 2014. These economic changes help gauge the overall strength of Wyoming’s economy and identify the fastest and slowest growing sectors and geographic areas.
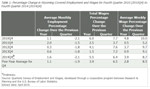 |
Total unemployment insurance (UI) covered payroll increased by $184.4 million (5.5%) in fourth quarter 2014. Employment rose by 4,426 jobs (1.6%) and average weekly wage increased by $36 (3.9%). In fourth quarter, employment (1.6% compared to 1.1%), total wages (5.5% compared to 3.9%), and average weekly wage (3.9% compared to 2.8%; see Table 1) all grew faster than their five year averages. However, job growth and payroll growth both slowed slightly from third to fourth quarter. In terms of dollars, UI covered payroll represents approximately 91.5% of all wage and salary disbursements and 43.8% of personal income in the state (U.S. Bureau of Economic Analysis, 2014). Analysts have noted that “minerals related employment is one of the key predictors of sales and use tax revenue” in Wyoming (CREG 2010).
Despite the recent growth, overall employment remained approximately 2,350 jobs (0.8%) below its fourth quarter 2008 level. It appears that the state is getting close to making up all the job losses of 2009 and 2010.
The covered payroll and employment data in this article are tabulated by place of work, in contrast to the labor force estimates which are a measure of employed and unemployed persons by place of residence. Also, the employment data presented in this article represent a count of jobs, not persons. When individuals work more than one job, each job is counted separately. Finally, job growth (or decline) is stated in terms of net change. The Quarterly Turnover Statistics by Industry table presents alternative measures of job gains and losses using the same data sources and calculated to describe the components of change.
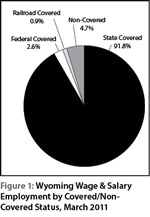 |
Figure 1 shows Wyoming wage & salary employment by covered/non-covered status. Approximately 92% of wage & salary jobs in the state are covered by state unemployment insurance, while 2.6% of jobs are covered by federal unemployment insurance, and 0.9% are covered by unemployment insurance administered by the railroad retirement board. There are several categories of non-covered jobs, and together they account for approximately 5% of wage & salary jobs in the state. Some examples of non-covered employment include elected officials, students working at educational institutions, employees of churches, and workers at small non-profit organizations.
 |
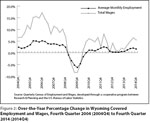 |
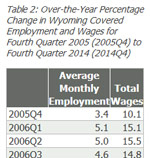
In fourth quarter 2014, job growth and total payroll growth both slowed slightly (see Figure 2). Table 2 shows that job growth (at 1.6% in fourth quarter) was modestly lower than in second and third quarters (1.8% and 2.0%, respectively). Growth in total wages was also marginally slower in fourth quarter than in third (5.5% in fourth quarter compared to 6.4% in third).
Employment and
Wages by County
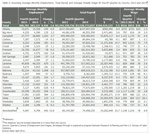 |
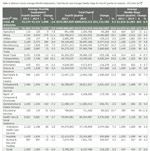
Employment rose in 14 counties and fell in 9 counties (see Table 3). Total payroll increased in 18 counties and decreased in five counties.
Campbell added 1,022 jobs (3.7%) and its total payroll rose by $33.9 million (8.4%). The largest job gains were seen in mining (including oil & gas; approximately 400 jobs), construction (approximately 250 jobs), and accommodation & food services (nearly 100 jobs).
Employment in Teton County rose by 564 jobs (3.3%) and its total payroll grew by $34.1 million (17.9%). Strong growth was seen in accommodation & food services (nearly 200 jobs), construction (approximately 100 jobs), and retail trade (approximately 100 jobs).
Converse County added 393 jobs (6.3%) and its total payroll rose by $11.3 million (14.7%). Construction gained approximately 200 jobs and smaller job gains were seen in mining (including oil & gas); arts, entertainment & recreation; retail trade; and manufacturing.
Sweetwater County lost 306 jobs (-1.2%), but its total payroll rose by $5.6 million (1.6%). Mining employment (including oil & gas) fell by approximately 200 jobs and smaller job losses were seen in retail trade, accommodation & food services, real estate & rental & leasing, manufacturing, and administrative & waste services.
Employment in Sublette County fell by 226 jobs (-4.4%) and its total payroll decreased by $1.2 million (-1.5%). Job losses were seen in administrative & waste services, construction, mining (including oil & gas), accommodation & food services, and wholesale trade.
Goshen County lost 182 jobs (-3.8%) and its total payroll fell by $53,873 (-0.1%). Small job losses were seen in health care & social assistance, construction, manufacturing, state government, local government, agriculture, and professional & technical services.
Employment in Albany County fell by 144 jobs (-0.9%), but total payroll rose by $0.6 million (0.4%). Job losses occurred in accommodation & food services, wholesale trade, state government, other services, and private educational services.
 |
Natrona County (see Table 4) gained 1,098 jobs (2.6%) and its total payroll grew by $51.1 million (9.2%). The largest job gains were found in mining (including oil & gas; 479 jobs, or 11.5%), construction (284 jobs, or 8.9%), transportation & warehousing (200 jobs, or 16.2%), and manufacturing (129 jobs, or 7.5%). Employment fell in other services (-109 jobs, or -6.1%) and administrative & waste services (-102 jobs, or -7.3%).
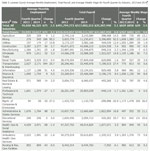 |
Laramie County (see Table 5) added 675 jobs (1.5%) and its total payroll rose by $25.2 million (5.1%). Employment rose rapidly in transportation & warehousing (544 jobs, or 20.7%), mining (including oil & gas; 266 jobs, or 95.3%), and accommodation & food services (120 jobs, or 2.8%). Job losses occurred in retail trade (-313 jobs, or -5.4%), other services (-112 jobs, or -7.9%), and health care & social assistance (-58 jobs, or -1.4%).
Statewide Employment
and Wages by Industry
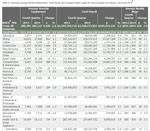 |
At the statewide level, the largest job gains occurred in construction, transportation & warehousing, mining (including oil & gas), accommodation & food services, and manufacturing (see Table 6). Job losses were seen in other services, state government, agriculture, and administrative & waste services.
Construction added 1,666 jobs (7.5%) and its total payroll rose by $11.3 million (3.5%). Specialty trade contractors gained approximately 1,000 jobs, heavy & civil engineering construction gained nearly 700 jobs, and construction of buildings fell slightly. A large part of the construction job gains were found in oil & gas pipelines & related structures construction.
Employment in transportation & warehousing rose by 989 jobs (10.0%) and its total payroll grew by $19.7 million (15.9%). Large job gains were seen in warehousing & storage (approximately 350 jobs), truck transportation (approximately 350 jobs), support activities for transportation (approximately 200 jobs), and transit & ground passenger transportation (approximately 100 jobs). Employment fell in air transportation (approximately 100 jobs). It appears that much of the job growth in transportation was related to energy development around the state.
Mining (including oil & gas) employment grew by 842 jobs (3.1%) and its total payroll rose by $43.3 million (7.3%). The largest growth was in support activities for mining, which includes oil & gas well drilling and support activities for oil & gas operations.
Accommodation & food services added 543 jobs (1.8%) and its total payroll rose by $10.6 million (8.1%). Employment in food services & drinking places increased by more than 400 jobs, while employment in accommodation increased by approximately 100 jobs.
Manufacturing gained 337 jobs (3.4%) and its total payroll grew by $12.7 million (8.7%). Employment increased in fabricated metal product manufacturing (approximately 200 jobs), computer & electronic product manufacturing (approximately 150 jobs), and petroleum & coal products manufacturing (approximately 100 jobs). These job gains were partially offset by job losses in machinery manufacturing (approximately 100 jobs).
Employment in other services fell by 241 jobs (-3.0%) and its total payroll decreased by $1.7 million (-2.3%). Repair & maintenance services lost approximately 100 jobs and smaller job losses were seen in personal & laundry services, membership associations & organizations, and private households.
State government lost 199 jobs (-1.5%) and its total payroll fell by $0.4 million (-0.2%). Employment fell slightly in many different state agencies and institutions.
Agriculture lost 107 jobs (-4.2%), but its total payroll rose by $1.2 million (4.9%). Employment decreases were seen in both crop production and animal production.
Administrative & waste services lost 103 jobs (-1.3%), but its total payroll rose by $2.0 million (3.1%). Employment fell in office administrative services, investigation & security services, and waste management & remediation services.
In summary, overall job growth slowed slightly from third to fourth quarter, with construction contributing fewer new jobs (1,666 new jobs in fourth quarter, compared to 2,401 new jobs in third quarter). Growth appeared especially strong in mining (including oil & gas) and transportation & warehousing. Several counties enjoyed solid economic growth, including Natrona, Campbell, Laramie, and Teton. The two counties with the largest job losses were located in the southwest region of the state (Sweetwater and Sublette).
References
Consensus Revenue Estimating Group (CREG). (2010, October). Wyoming state government revenue forecast fiscal year 2011-fiscal year 2016. Retrieved February 17, 2011 from http://eadiv.state.wy.us/creg/GreenCREG_Oct10.pdf
U.S. Bureau of Economic Analysis. (2014, June 17). SA04 State income and employment summary. Retrieved June 17, 2014, from http://www.bea.gov/iTable/iTable.cfm?ReqID=70&step=1&isuri=1&acrdn=4