|
Initial Claims
|
Claims Filed
|
% Change
Claims Filed |
May
15 |
May
15 |
May
15 |
Apr
15 |
May
14 |
Apr
15 |
May
14 |
|
Wyoming Statewide
|
|
|
|
|
|
|
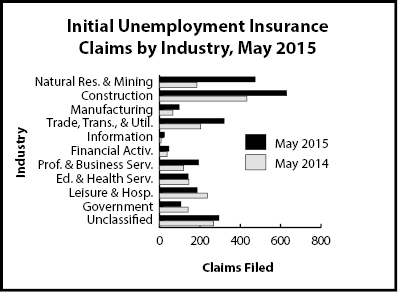
TOTAL CLAIMS FILED
|
2,579
|
3,069
|
1,893
|
-16.0
|
36.2
|
|
TOTAL GOODS-PRODUCING
|
1,202
|
1,200
|
685
|
0.2
|
75.5
|
|
Natural Res. & Mining
|
474
|
581
|
185
|
-18.4
|
156.2
|
|
Mining
|
454
|
575
|
169
|
-21.0
|
168.6
|
|
Oil & Gas Extraction
|
18
|
46
|
4
|
-60.9
|
350.0
|
|
Construction
|
630
|
497
|
433
|
26.8
|
45.5
|
|
Manufacturing
|
97
|
122
|
66
|
-20.5
|
47.0
|
|
TOTAL SERVICE-PROVIDING
|
976
|
1,440
|
797
|
-32.2
|
22.5
|
|
Trade, Transp., & Utilities
|
320
|
411
|
204
|
-22.1
|
56.9
|
|
Wholesale Trade
|
68
|
84
|
30
|
-19.0
|
126.7
|
|
Retail Trade
|
115
|
120
|
112
|
-4.2
|
2.7
|
|
Transp., Warehousing & Utilities
|
137
|
207
|
62
|
-33.8
|
121.0
|
|
Information
|
24
|
15
|
8
|
60.0
|
200.0
|
|
Financial Activities
|
46
|
89
|
37
|
-48.3
|
24.3
|
|
Prof. & Business Svcs.
|
194
|
170
|
119
|
14.1
|
63.0
|
|
Educational & Health Svcs.
|
142
|
74
|
145
|
91.9
|
-2.1
|
|
Leisure & Hospitality
|
186
|
609
|
237
|
-69.5
|
-21.5
|
|
Other Svcs., exc. Public Admin.
|
58
|
65
|
41
|
-10.8
|
41.5
|
|
TOTAL GOVERNMENT
|
106
|
126
|
141
|
-15.9
|
-24.8
|
|
Federal Government
|
22
|
32
|
36
|
-31.3
|
-38.9
|
|
State Government
|
20
|
19
|
17
|
5.3
|
17.6
|
|
Local Government
|
62
|
73
|
87
|
-15.1
|
-28.7
|
|
Local Education
|
11
|
14
|
17
|
-21.4
|
-35.3
|
|
UNCLASSIFIED
|
294
|
302
|
268
|
-2.6
|
9.7
|
|
Laramie County
|
|
|
|
|
|
|
TOTAL CLAIMS FILED
|
330
|
239
|
285
|
38.1
|
15.8
|
|
TOTAL GOODS-PRODUCING
|
135
|
92
|
97
|
46.7
|
39.2
|
|
Construction
|
106
|
61
|
82
|
73.8
|
29.3
|
|
TOTAL SERVICE-PROVIDING
|
171
|
111
|
162
|
54.1
|
5.6
|
|
Trade, Transp., & Utilities
|
45
|
41
|
36
|
9.8
|
25.0
|
|
Financial Activities
|
9
|
10
|
12
|
-10.0
|
-25.0
|
|
Prof. & Business Svcs.
|
64
|
33
|
52
|
93.9
|
23.1
|
|
Educational & Health Svcs.
|
43
|
9
|
41
|
377.8
|
4.9
|
|
Leisure & Hospitality
|
16
|
13
|
30
|
23.1
|
-46.7
|
|
TOTAL GOVERNMENT
|
12
|
19
|
17
|
-36.8
|
-29.4
|
|
UNCLASSIFIED
|
10
|
14
|
8
|
-28.6
|
25.0
|
|
Natrona County
|
|
|
|
|
|
|
TOTAL CLAIMS FILED
|
454
|
479
|
218
|
-5.2
|
108.3
|
|
TOTAL GOODS-PRODUCING
|
243
|
220
|
84
|
10.5
|
189.3
|
|
Construction
|
100
|
81
|
44
|
23.5
|
127.3
|
|
TOTAL SERVICE-PROVIDING
|
187
|
236
|
122
|
-20.8
|
53.3
|
|
Trade, Transp., & Utilities
|
73
|
108
|
35
|
-32.4
|
108.6
|
|
Financial Activities
|
11
|
20
|
5
|
-45.0
|
120.0
|
|
Prof. & Business Svcs.
|
64
|
52
|
32
|
23.1
|
100.0
|
|
Educational & Health Svcs.
|
19
|
15
|
25
|
26.7
|
-24.0
|
|
Leisure & Hospitality
|
24
|
26
|
27
|
-7.7
|
-11.1
|
|
TOTAL GOVERNMENT
|
4
|
9
|
10
|
-55.6
|
-60.0
|
|
UNCLASSIFIED
|
19
|
12
|
1
|
58.3
|
1,800.0
|