
Local Jobs and Payroll in Wyoming: Job Growth Accelerates in 2011Q4 (Tables and Figures)
See Related Article
Tables 1, 2, 3, 4, 5*, 6*
Figures 1, 2, 3
*Due to space considerations, Table 5 (Natrona County) and Table 6 (Laramie County) do not appear in the printed version of Trends.
|
Average Monthly Employment Percentage Change Over the Previous |
Total Wages Percentage Change Over the Previous |
Average Weekly Wage Percentage Change Over the Previous |
||||
|---|---|---|---|---|---|---|
| Year | Quarter | Year | Quarter | Year | Quarter | |
| 2007Q4 | 3.8 | -1.2 | 11.3 | 9.7 | 7.2 | 11.1 |
| 2008Q4 | 2.4 | -2.2 | 6.8 | 6.4 | 4.3 | 8.8 |
| 2009Q4 | -6.3 | -3.2 | -8.4 | 6.4 | -2.2 | 9.9 |
| 2010Q4 | 1.1 | -2.1 | 6.0 | 7.7 | 4.8 | 10.0 |
| 2011Q4a | 2.0 | -1.5 | 2.5 | 3.6 | 0.6 | 5.3 |
| Five-Year Average for Q4 | 0.6 | -2.0 | 3.6 | 6.8 | 2.9 | 9.0 |
| aPreliminary. | ||||||
| Source: Quarterly Census of Employment and Wages, developed through a cooperative program between Research & Planning and the U.S. Bureau of Labor Statistics. | ||||||
| Extract date: April 2012. | ||||||
|
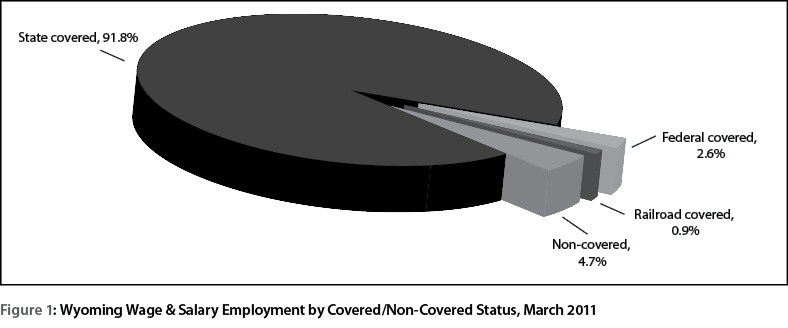
Average Monthly Employment |
Total Wages |
|
|---|---|---|
| 2004Q4 | 2.4 | 6.5 |
| 2005Q1 | 1.9 | 6.6 |
| 2005Q2 | 2.1 | 8.3 |
| 2005Q3 | 2.7 | 11.7 |
| 2005Q4 | 3.4 | 10.1 |
| 2006Q1 | 5.1 | 15.1 |
| 2006Q2 | 5.0 | 15.5 |
| 2006Q3 | 4.6 | 14.8 |
| 2006Q4 | 5.1 | 17.1 |
| 2007Q1 | 4.8 | 14.5 |
| 2007Q2 | 3.9 | 12.4 |
| 2007Q3 | 3.7 | 8.0 |
| 2007Q4 | 3.8 | 11.3 |
| 2008Q1 | 3.6 | 10.6 |
| 2008Q2 | 3.1 | 8.7 |
| 2008Q3 | 3.4 | 10.1 |
| 2008Q4 | 2.4 | 6.8 |
| 2009Q1 | -1.0 | -1.2 |
| 2009Q2 | -3.4 | -5.0 |
| 2009Q3 | -5.3 | -8.4 |
| 2009Q4 | -6.3 | -8.4 |
| 2010Q1 | -4.7 | -4.9 |
| 2010Q2 | -1.7 | 1.1 |
| 2010Q3 | 0.0 | 4.8 |
| 2010Q4 | 1.1 | 6.0 |
| 2011Q1 | 1.1 | 5.4 |
| 2011Q2 | 0.8 | 4.7 |
| 2011Q3 | 1.4 | 6.5 |
| 2011Q4a | 2.0 | 2.5 |
| aPreliminary. | ||
| Source: Quarterly Census of Employment and Wages, developed through a cooperative program between Research & Planning and the U.S. Bureau of Labor Statistics. | ||
| Extract date: April 2012. | ||
| County |
Average Monthly Employment |
Total Payroll |
Average Weekly Wage |
|||||||||
|---|---|---|---|---|---|---|---|---|---|---|---|---|
|
Fourth Quarter |
Change |
Fourth Quarter |
Change | Fourth Quarter | Change | |||||||
| 2010 | 2011 | n | % | 2010 | 2011 | $ | % | 2010 | 2011 | $ | % | |
| Total | 272,511 | 277,878 | 5,367 | 2.0 | $3,087,069,661 | $3,165,285,555 | $78,215,894 | 2.5 | $871 | $876 | $5 | 0.6 |
| Albany | 15,372 | 15,566 | 194 | 1.3 | $140,859,925 | $152,046,844 | $11,186,919 | 7.9 | $705 | $751 | $46 | 6.5 |
| Big Horn | 4,204 | 4,341 | 137 | 3.3 | 39,992,638 | 41,705,225 | 1,712,587 | 4.3 | 732 | 739 | 7 | 1.0 |
| Campbell | 28,466 | 28,075 | -391 | -1.4 | 421,910,661 | 398,130,097 | -23,780,564 | -5.6 | 1,140 | 1,091 | -49 | -4.3 |
| Carbon | 6,685 | 6,561 | -124 | -1.9 | 69,596,695 | 74,017,693 | 4,420,998 | 6.4 | 801 | 868 | 67 | 8.4 |
| Converse | 5,411 | 5,754 | 343 | 6.3 | 60,724,492 | 65,054,161 | 4,329,669 | 7.1 | 863 | 870 | 7 | 0.8 |
| Crook | 2,336 | 2,304 | -32 | -1.4 | 21,675,014 | 20,593,314 | -1,081,700 | -5.0 | 714 | 688 | -26 | -3.6 |
| Fremont | 16,797 | 16,917 | 120 | 0.7 | 163,119,468 | 166,608,031 | 3,488,563 | 2.1 | 747 | 758 | 11 | 1.5 |
| Goshen | 4,661 | 4,762 | 101 | 2.2 | 37,942,067 | 39,778,932 | 1,836,865 | 4.8 | 626 | 643 | 17 | 2.7 |
| Hot Springs | 2,108 | 2,133 | 25 | 1.2 | 17,943,331 | 18,656,753 | 713,422 | 4.0 | 655 | 673 | 18 | 2.7 |
| Johnson | 3,342 | 3,255 | -87 | -2.6 | 28,181,944 | 27,859,598 | -322,346 | -1.1 | 649 | 658 | 9 | 1.4 |
| Laramie | 42,746 | 43,574 | 828 | 1.9 | 438,684,885 | 448,762,866 | 10,077,981 | 2.3 | 789 | 792 | 3 | 0.4 |
| Lincoln | 6,094 | 6,089 | -5 | -0.1 | 65,594,415 | 66,923,199 | 1,328,784 | 2.0 | 828 | 845 | 17 | 2.1 |
| Natrona | 38,487 | 40,261 | 1,774 | 4.6 | 466,193,631 | 498,822,550 | 32,628,919 | 7.0 | 932 | 953 | 21 | 2.3 |
| Niobrara | 870 | 919 | 49 | 5.6 | 6,883,462 | 7,295,492 | 412,030 | 6.0 | 609 | 611 | 2 | 0.3 |
| Park | 12,803 | 13,208 | 405 | 3.2 | 124,315,207 | 128,043,055 | 3,727,848 | 3.0 | 747 | 746 | -1 | -0.1 |
| Platte | 3,459 | 3,421 | -38 | -1.1 | 33,438,016 | 32,534,598 | -903,418 | -2.7 | 744 | 732 | -12 | -1.6 |
| Sheridan | 12,953 | 12,947 | -6 | 0.0 | 131,082,724 | 130,307,290 | -775,434 | -0.6 | 778 | 774 | -4 | -0.5 |
| Sublette | 5,628 | 6,174 | 546 | 9.7 | 83,793,346 | 92,446,990 | 8,653,644 | 10.3 | 1,145 | 1,152 | 7 | 0.6 |
| Sweetwater | 24,260 | 24,983 | 723 | 3.0 | 334,190,642 | 346,824,662 | 12,634,020 | 3.8 | 1,060 | 1,068 | 8 | 0.8 |
| Teton | 15,523 | 15,830 | 307 | 2.0 | 171,578,719 | 169,975,750 | -1,602,969 | -0.9 | 850 | 826 | -24 | -2.8 |
| Uinta | 9,788 | 9,223 | -565 | -5.8 | 116,441,618 | 95,662,133 | -20,779,485 | -17.8 | 915 | 798 | -117 | -12.8 |
| Washakie | 4,011 | 3,996 | -15 | -0.4 | 37,809,990 | 38,023,768 | 213,778 | 0.6 | 725 | 732 | 7 | 1.0 |
| Weston | 2,324 | 2,329 | 5 | 0.2 | 21,034,340 | 20,161,745 | -872,595 | -4.1 | 696 | 666 | -30 | -4.3 |
| Nonclassifiedb | 4,183 | 5,256 | 1,072 | 25.6 | 54,082,431 | 85,050,809 | 30,968,378 | 57.3 | 994 | 1,245 | 250 | 25.2 |
| aPreliminary. | ||||||||||||
| bThe employer may be located statewide or in more than one county. | ||||||||||||
| Source: Quarterly Census of Employment and Wages, developed through a cooperative program between Research & Planning and the U.S. Bureau of Labor Statistics. | ||||||||||||
| Extract date: April 2012. | ||||||||||||
| NAICSb Title |
Average Monthly Employment |
Total Payroll |
Average Weekly Wage |
|||||||||
|---|---|---|---|---|---|---|---|---|---|---|---|---|
|
Fourth Quarter |
Change |
Fourth Quarter |
Change | Fourth Quarter | Change | |||||||
| 2010 | 2011 | n | % | 2010 | 2011 | $ | % | 2010 | 2011 | $ | % | |
| Total, All Industries | 272,511 | 277,878 | 5,367 | 2.0 | $3,087,069,661 | $3,165,285,555 | $78,215,894 | 2.5 | $871 | $876 | $5 | 0.6 |
| Total Private | 205,619 | 210,824 | 5,205 | 2.5 | $2,337,419,603 | $2,413,687,771 | $76,268,168 | 3.3 | $874 | $881 | $7 | 0.8 |
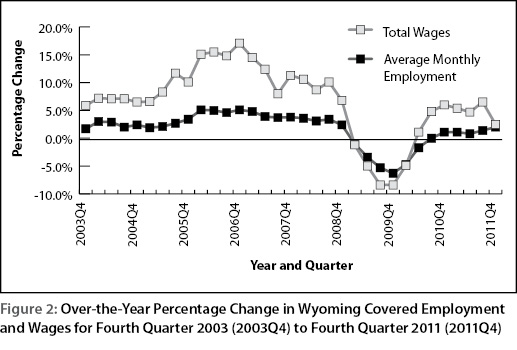
| Agriculture | 2,368 | 2,427 | 59 | 2.5 | 20,115,044 | 22,538,226 | 2,423,182 | 12.0 | 653 | 714 | 61 | 9.3 |
| Mining | 26,128 | 28,599 | 2,471 | 9.5 | 532,712,895 | 584,085,385 | 51,372,490 | 9.6 | 1,568 | 1,571 | 3 | 0.2 |
| Utilities | 2,495 | 2,467 | -28 | -1.1 | 54,394,276 | 51,023,733 | -3,370,543 | -6.2 | 1,677 | 1,591 | -86 | -5.1 |
| Construction | 22,540 | 22,136 | -404 | -1.8 | 303,628,159 | 288,200,351 | -15,427,808 | -5.1 | 1,036 | 1,002 | -34 | -3.3 |
| Manufacturing | 9,115 | 9,732 | 617 | 6.8 | 125,209,643 | 134,774,220 | 9,564,577 | 7.6 | 1,057 | 1,065 | 8 | 0.8 |
| Wholesale Trade | 8,527 | 9,004 | 477 | 5.6 | 133,741,572 | 139,746,785 | 6,005,213 | 4.5 | 1,206 | 1,194 | -12 | -1.0 |
| Retail Trade | 29,484 | 29,457 | -27 | -0.1 | 196,122,576 | 195,848,538 | -274,038 | -0.1 | 512 | 511 | -1 | -0.2 |
| Transportation & Warehousing | 9,160 | 9,562 | 402 | 4.4 | 110,485,983 | 117,027,800 | 6,541,817 | 5.9 | 928 | 941 | 13 | 1.4 |
| Information | 3,836 | 3,851 | 15 | 0.4 | 41,381,069 | 40,251,069 | -1,130,000 | -2.7 | 830 | 804 | -26 | -3.1 |
| Finance & Insurance | 6,779 | 6,680 | -99 | -1.5 | 88,709,915 | 85,789,353 | -2,920,562 | -3.3 | 1,007 | 988 | -19 | -1.9 |
| Real Estate & Rental & Leasing | 3,981 | 3,967 | -14 | -0.4 | 44,457,487 | 45,659,650 | 1,202,163 | 2.7 | 859 | 885 | 26 | 3.0 |
| Professional & Technical Svcs. | 9,080 | 9,100 | 20 | 0.2 | 144,259,962 | 143,676,356 | -583,606 | -0.4 | 1,222 | 1,215 | -7 | -0.6 |
| Mgmt. of Cos. & Enterprises | 847 | 868 | 21 | 2.5 | 20,079,446 | 18,027,022 | -2,052,424 | -10.2 | 1,824 | 1,598 | -226 | -12.4 |
| Administrative & Waste Services | 7,220 | 7,927 | 707 | 9.8 | 54,643,634 | 73,358,929 | 18,715,295 | 34.2 | 582 | 712 | 130 | 22.3 |
| Educational Services | 1,864 | 1,700 | -164 | -8.8 | 13,045,554 | 12,308,691 | -736,863 | -5.6 | 538 | 557 | 19 | 3.5 |
| Health Care & Social Assistance | 23,482 | 23,650 | 168 | 0.7 | 253,612,133 | 253,744,486 | 132,353 | 0.1 | 831 | 825 | -6 | -0.7 |
| Ambulatory Health Care Svcs. | 8,809 | 9,007 | 198 | 2.2 | 142,138,408 | 142,697,520 | 559,112 | 0.4 | 1,241 | 1,219 | -22 | -1.8 |
| Hospitals | 3,334 | 3,239 | -95 | -2.8 | 43,463,980 | 42,088,296 | -1,375,684 | -3.2 | 1,003 | 1,000 | -3 | -0.3 |
| Nursing & Res. Care Facilities | 4,554 | 4,607 | 53 | 1.2 | 32,541,778 | 33,129,131 | 587,353 | 1.8 | 550 | 553 | 3 | 0.5 |
| Social Assistance | 6,784 | 6,797 | 13 | 0.2 | 35,467,967 | 35,829,539 | 361,572 | 1.0 | 402 | 405 | 3 | 0.7 |
| Arts, Ent., & Recreation | 2,357 | 2,450 | 93 | 3.9 | 12,407,012 | 12,122,478 | -284,534 | -2.3 | 405 | 381 | -24 | -5.9 |
| Accomm. & Food Services | 28,357 | 28,896 | 539 | 1.9 | 119,717,436 | 121,181,128 | 1,463,692 | 1.2 | 325 | 323 | -2 | -0.6 |
| Other Services | 7,999 | 8,351 | 352 | 4.4 | 68,695,807 | 74,323,571 | 5,627,764 | 8.2 | 661 | 685 | 24 | 3.6 |
| Total Government | 66,891 | 67,054 | 163 | 0.2 | $749,650,058 | $751,597,784 | $1,947,726 | 0.3 | $862 | $862 | $0 | 0.0 |
| Federal Government | 7,429 | 7,309 | -120 | -1.6 | 116,609,905 | 111,013,739 | -5,596,166 | -4.8 | 1,207 | 1,168 | -39 | -3.2 |
| State Government | 13,244 | 13,200 | -44 | -0.3 | 168,880,522 | 171,840,475 | 2,959,953 | 1.8 | 981 | 1,001 | 20 | 2.0 |
| State Government Education | 3,602 | 3,671 | 68 | 1.9 | 44,886,520 | 45,850,511 | 963,991 | 2.1 | 958 | 961 | 2 | 0.2 |
| Local Government | 46,218 | 46,544 | 326 | 0.7 | 464,159,631 | 468,743,570 | 4,583,939 | 1.0 | 773 | 775 | 2 | 0.3 |
| Local Government Education | 24,533 | 24,661 | 128 | 0.5 | 237,617,150 | 241,598,548 | 3,981,398 | 1.7 | 745 | 754 | 9 | 1.1 |
| Hospitals | 6,607 | 6,710 | 103 | 1.6 | 87,085,015 | 87,420,594 | 335,579 | 0.4 | 1,014 | 1,002 | -12 | -1.2 |
| aPreliminary. | ||||||||||||
| bNorth American Industry Classification System. | ||||||||||||
| Source: Quarterly Census of Employment and Wages, developed through a cooperative program between Research & Planning and the U.S. Bureau of Labor Statistics. | ||||||||||||
| Extract date: April 2012. | ||||||||||||
| NAICSb Title | Average Monthly Employment | Total Payroll | Average Weekly Wage | |||||||||
|---|---|---|---|---|---|---|---|---|---|---|---|---|
| Fourth Quarter | Change | Fourth Quarter | Change | Fourth Quarter | Change | |||||||
| 2010 | 2011 | n | % | 2010 | 2011 | $ | % | 2010 | 2011 | $ | % | |
| Total, All Industries | 38,487 | 40,261 | 1,774 | 4.6 | $466,193,631 | $498,822,550 | $32,628,919 | 7.0 | $932 | $953 | $21 | 2.3 |
| Total Private | 32,726 | 34,490 | 1,764 | 5.4 | $399,320,106 | $430,922,899 | $31,602,793 | 7.9 | $939 | $961 | $22 | 2.3 |
| Agriculture | 123 | 109 | -14 | -11.4 | 831,127 | 944,947 | 113,820 | 13.7 | 520 | 667 | 147 | 28.3 |
| Mining | 3,530 | 3,978 | 448 | 12.7 | 78,811,532 | 92,321,308 | 13,509,776 | 17.1 | 1,717 | 1,785 | 68 | 4.0 |
| Utilities | 126 | 135 | 9 | 7.1 | 3,245,735 | 3,130,659 | -115,076 | -3.5 | 1,982 | 1,784 | -198 | -10.0 |
| Construction | 2,630 | 2,674 | 44 | 1.7 | 36,250,995 | 37,404,800 | 1,153,805 | 3.2 | 1,060 | 1,076 | 16 | 1.5 |
| Manufacturing | 1,680 | 1,849 | 169 | 10.1 | 21,609,531 | 23,959,063 | 2,349,532 | 10.9 | 989 | 997 | 8 | 0.8 |
| Wholesale Trade | 2,368 | 2,584 | 216 | 9.1 | 39,866,430 | 44,870,176 | 5,003,746 | 12.6 | 1,295 | 1,336 | 41 | 3.2 |
| Retail Trade | 4,723 | 4,820 | 97 | 2.1 | 32,985,021 | 34,032,650 | 1,047,629 | 3.2 | 537 | 543 | 6 | 1.1 |
| Transp.& Warehousing | 987 | 1,078 | 91 | 9.2 | 13,236,570 | 15,546,786 | 2,310,216 | 17.5 | 1,032 | 1,109 | 77 | 7.5 |
| Information | 484 | 470 | -14 | -2.9 | 5,519,266 | 4,423,081 | -1,096,185 | -19.9 | 877 | 724 | -153 | -17.4 |
| Finance & Insurance | 1,018 | 1,013 | -5 | -0.5 | 14,182,148 | 13,633,054 | -549,094 | -3.9 | 1,072 | 1,035 | -37 | -3.5 |
| Real Est. & Rental & Leasing | 872 | 891 | 19 | 2.2 | 10,232,264 | 10,587,660 | 355,396 | 3.5 | 903 | 914 | 11 | 1.2 |
| Professional & Technical Services | 1,402 | 1,438 | 36 | 2.6 | 23,383,516 | 25,806,983 | 2,423,467 | 10.4 | 1,283 | 1,380 | 97 | 7.6 |
| Mgmt. of Companies & Enterprises | 155 | 157 | 2 | 1.3 | 3,310,609 | 3,677,416 | 366,807 | 11.1 | 1,643 | 1,802 | 159 | 9.7 |
| Administrative & Waste Services | 1,228 | 1,383 | 155 | 12.6 | 9,240,481 | 10,980,228 | 1,739,747 | 18.8 | 579 | 611 | 32 | 5.5 |
| Educational Services | 133 | 137 | 4 | 3.0 | 659,091 | 754,531 | 95,440 | 14.5 | 381 | 424 | 43 | 11.3 |
| Health Care & Social Assistance | 5,587 | 5,601 | 14 | 0.3 | 72,865,986 | 71,808,548 | -1,057,438 | -1.5 | 1,003 | 986 | -17 | -1.7 |
| Ambulatory Health Care Services | 1,858 | 1,899 | 41 | 2.2 | 35,919,369 | 35,903,716 | -15,653 | 0.0 | 1,487 | 1,454 | -33 | -2.2 |
| Hospitals | 1,759 | 1,713 | -46 | -2.6 | 24,124,166 | 23,034,883 | -1,089,283 | -4.5 | 1,055 | 1,034 | -21 | -2.0 |
| Nursing & Residential Care Facilities | 957 | 937 | -20 | -2.1 | 7,484,028 | 7,347,626 | -136,402 | -1.8 | 602 | 603 | 1 | 0.2 |
| Social Assistance | 1,012 | 1,052 | 40 | 4.0 | 5,338,423 | 5,522,323 | 183,900 | 3.4 | 406 | 404 | -2 | -0.5 |
| Arts, Entertainment, & Recreation | 374 | 428 | 54 | 14.4 | 1,594,071 | 1,693,447 | 99,376 | 6.2 | 328 | 304 | -24 | -7.3 |
| Accommodation & Food Services | 3,525 | 3,778 | 253 | 7.2 | 13,393,543 | 14,478,707 | 1,085,164 | 8.1 | 292 | 295 | 3 | 1.0 |
| Other Services | 1,783 | 1,967 | 184 | 10.3 | 18,102,190 | 20,868,855 | 2,766,665 | 15.3 | 781 | 816 | 35 | 4.5 |
| Total Government | 5,760 | 5,771 | 11 | 0.2 | $66,873,525 | $67,899,651 | $1,026,126 | 1.5 | $893 | $905 | $12 | 1.3 |
| Federal Government | 691 | 678 | -13 | -1.9 | 12,101,280 | 11,782,809 | -318,471 | -2.6 | 1,347 | 1,337 | -10 | -0.7 |
| State Government | 699 | 715 | 16 | 2.3 | 9,138,832 | 9,593,891 | 455,059 | 5.0 | 1,006 | 1,032 | 26 | 2.6 |
| Local Government | 4,370 | 4,378 | 8 | 0.2 | 45,633,413 | 46,522,951 | 889,538 | 1.9 | 803 | 817 | 14 | 1.7 |
| Local Government Education | ND | ND | ND | ND | ND | ND | ND | ND | ND | ND | ND | ND |
| aPreliminary. | ||||||||||||
| bNorth American Industry Classification System. | ||||||||||||
| ND-Not disclosable due to confidentiality of information. | ||||||||||||
| Source: Quarterly Census of Employment and Wages, developed through a cooperative program between Research & Planning and the U.S. Bureau of Labor Statistics. | ||||||||||||
| Extract date: April 2012. | ||||||||||||
| NAICSb Title | Average Monthly Employment | Total Payroll | Average Weekly Wage | |||||||||
|---|---|---|---|---|---|---|---|---|---|---|---|---|
| Fourth Quarter | Change | Fourth Quarter | Change | Fourth Quarter | Change | |||||||
| 2010 | 2011 | n | % | 2010 | 2011 | $ | % | 2010 | 2011 | $ | % | |
| Total, All Industries | 42,746 | 43,574 | 828 | 1.9 | $438,684,885 | $448,762,866 | $10,077,981 | 2.3 | $789 | $792 | $3 | 0.4 |
| Total Private | 28,921 | 29,843 | 922 | 3.2 | $263,746,371 | $277,506,165 | $13,759,794 | 5.2 | $702 | $715 | $13 | 1.9 |
| Agriculture | 269 | 278 | 9 | 3.3 | 2,059,103 | 2,261,407 | 202,304 | 9.8 | 589 | 626 | 37 | 6.3 |
| Mining | 67 | 188 | 121 | 180.6 | 1,049,787 | 3,266,435 | 2,216,648 | 211.2 | 1,205 | 1,337 | 132 | 11.0 |
| Utilities | 140 | 134 | -6 | -4.3 | 2,462,712 | 2,554,583 | 91,871 | 3.7 | 1,353 | 1,466 | 113 | 8.4 |
| Construction | 2,486 | 2,775 | 289 | 11.6 | 26,994,912 | 29,705,755 | 2,710,843 | 10.0 | 835 | 823 | -12 | -1.4 |
| Manufacturing | 1,417 | 1,472 | 55 | 3.9 | 19,391,123 | 22,497,112 | 3,105,989 | 16.0 | 1,053 | 1,176 | 123 | 11.7 |
| Wholesale Trade | 810 | 829 | 19 | 2.3 | 10,571,231 | 11,110,049 | 538,818 | 5.1 | 1,004 | 1,031 | 27 | 2.7 |
| Retail Trade | 5,392 | 5,513 | 121 | 2.2 | 34,425,766 | 36,060,206 | 1,634,440 | 4.7 | 491 | 503 | 12 | 2.4 |
| Transp. & Warehousing | 2,299 | 2,345 | 46 | 2.0 | 22,808,686 | 23,727,241 | 918,555 | 4.0 | 763 | 778 | 15 | 2.0 |
| Information | 1,075 | 1,119 | 44 | 4.1 | 12,573,059 | 13,260,952 | 687,893 | 5.5 | 900 | 912 | 12 | 1.3 |
| Finance & Insurance | 1,647 | 1,649 | 2 | 0.1 | 20,657,528 | 19,492,170 | -1,165,358 | -5.6 | 965 | 909 | -56 | -5.8 |
| Real Est. & Rental & Leasing | 502 | 519 | 17 | 3.4 | 4,926,594 | 4,866,178 | -60,416 | -1.2 | 755 | 721 | -34 | -4.5 |
| Prof. & Technical Services | 1,490 | 1,522 | 32 | 2.1 | 22,692,190 | 23,879,300 | 1,187,110 | 5.2 | 1,172 | 1,207 | 35 | 3.0 |
| Mgmt. of Cos. & Enterprises | 71 | 50 | -21 | -29.6 | 989,634 | 852,049 | -137,585 | -13.9 | 1,072 | 1,311 | 239 | 22.3 |
| Admin. & Waste Services | 1,649 | 1,627 | -22 | -1.3 | 10,739,396 | 10,618,223 | -121,173 | -1.1 | 501 | 502 | 1 | 0.2 |
| Educational Services | 234 | 250 | 16 | 6.8 | 1,574,205 | 1,648,584 | 74,379 | 4.7 | 517 | 507 | -10 | -1.9 |
| Health Care & Social Assist. | 3,916 | 3,949 | 33 | 0.8 | 44,026,880 | 45,258,819 | 1,231,939 | 2.8 | 865 | 882 | 17 | 2.0 |
| Amb. Health Care Svcs. | 1,822 | 1,894 | 72 | 4.0 | 31,260,966 | 32,126,333 | 865,367 | 2.8 | 1,320 | 1,305 | -15 | -1.1 |
| Nursing & Res. Care Facils. | 882 | 860 | -22 | -2.5 | 6,259,174 | 6,334,891 | 75,717 | 1.2 | 546 | 567 | 21 | 3.8 |
| Hospitals & Social Assist. | 1,212 | 1,195 | -17 | -1.4 | 6,506,740 | 6,797,595 | 290,855 | 4.5 | 413 | 438 | 25 | 6.1 |
| Arts, Ent., & Recreation | 241 | 245 | 4 | 1.7 | 850,682 | 880,825 | 30,143 | 3.5 | 272 | 277 | 5 | 1.8 |
| Accomm. & Food Services | 3,990 | 4,107 | 117 | 2.9 | 15,646,761 | 15,724,260 | 77,499 | 0.5 | 302 | 295 | -7 | -2.3 |
| Other Services | 1,226 | 1,273 | 47 | 3.8 | 9,306,122 | 9,842,017 | 535,895 | 5.8 | 584 | 595 | 11 | 1.9 |
| Total Government | 13,825 | 13,731 | -94 | -0.7 | $174,938,514 | $171,256,701 | -$3,681,813 | -2.1 | $973 | $959 | -$14 | -1.4 |
| Federal Government | 2,638 | 2,606 | -32 | -1.2 | 43,720,970 | 40,403,478 | -3,317,492 | -7.6 | 1,275 | 1,193 | -82 | -6.4 |
| State Government | 4,001 | 3,987 | -14 | -0.3 | 56,699,450 | 57,302,156 | 602,706 | 1.1 | 1,090 | 1,106 | 16 | 1.5 |
| Local Government | 7,186 | 7,138 | -48 | -0.7 | 74,518,094 | 73,551,067 | -967,027 | -1.3 | 798 | 793 | -5 | -0.6 |
| Local Govt. Education | 3,848 | 3,823 | -25 | -0.6 | 37,068,943 | 38,289,179 | 1,220,236 | 3.3 | 741 | 770 | 29 | 4.0 |
| aPreliminary. | ||||||||||||
| bNorth American Industry Classification System. | ||||||||||||
| Source: Quarterly Census of Employment and Wages, developed through a cooperative program between Research & Planning and the U.S. Bureau of Labor Statistics. | ||||||||||||
| Extract date: April 2012. | ||||||||||||