Wyoming Jobless Rate Falls to 5.4% in February 2012
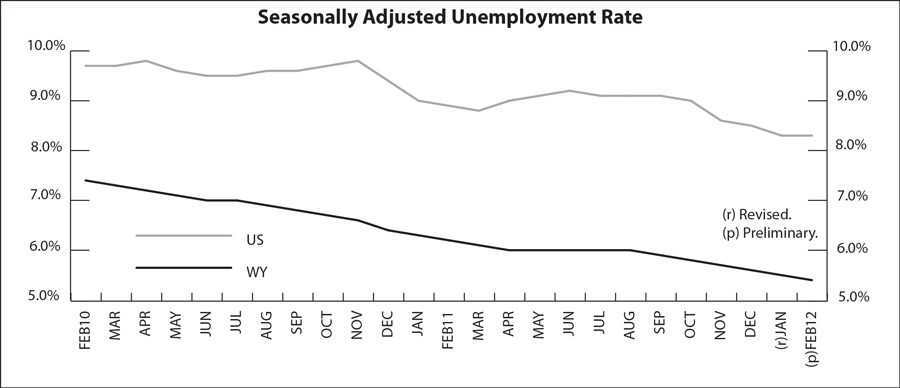
The Research & Planning section of the Wyoming Department of Workforce Services has reported that the state's seasonally adjusted1 unemployment rate decreased from 5.5% in January to 5.4% in February. Wyoming's unemployment rate has been steadily decreasing for the past six months and is considerably lower than its February 2011 level of 6.2%. The U.S. unemployment rate held steady at 8.3% in February. Seasonally adjusted employment of Wyoming residents rose by an estimated 907 people (0.3%) from January to February (not a statistically significant change).
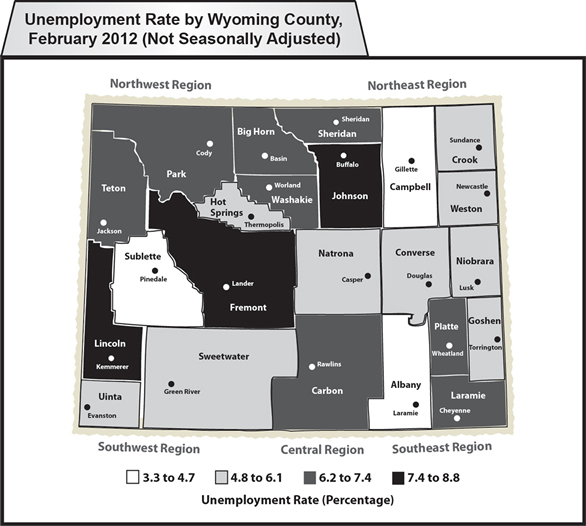
Most county unemployment rates followed their normal seasonal pattern and decreased slightly from January to February. Crook County was the exception, where the jobless rate edged upward from 5.7% to 6.0%. The largest over-the-month decreases occurred in Weston (down from 6.5% to 5.8%), Laramie (down from 7.3% to 6.7%), and Hot Springs (down from 5.9% to 5.3%) counties.
Lincoln County posted the highest unemployment rate in February (8.8%). It was followed by Johnson (7.7%), Fremont (7.4%), and Sheridan (7.3%) counties. The lowest unemployment rates were found in Sublette (3.3%), Campbell (4.5%), and Albany (4.6%) counties.
Jobless rates decreased from their year-ago levels in most areas of the state. Big Horn County reported the largest over-the-year decline, with unemployment falling from 8.7% to 6.7%. Large decreases were also seen in Johnson (down from 9.4% to 7.7%), Natrona (down from 6.9% to 5.4%), Lincoln (down from 10.1% to 8.8%), and Weston (down from 6.9% to 5.8%) counties.
Total nonfarm employment (measured by place of work) increased from 275,600 in February 2011 to 279,900 in February 2012, a gain of 4,300 jobs (1.6%).
1Seasonal adjustment is a statistical procedure to remove the impact of normal regularly recurring events (such as weather, major holidays, and the opening and closing of schools) from economic time series to better understand changes in economic conditions from month to month.