Wyoming Normalizeda Unemployment Insurance Statistics: Continued Claims
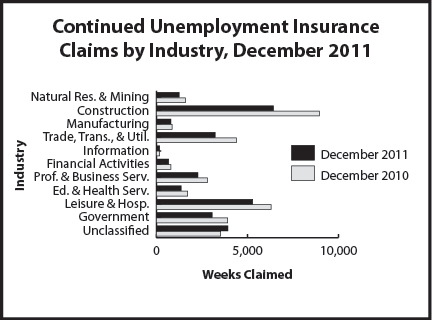
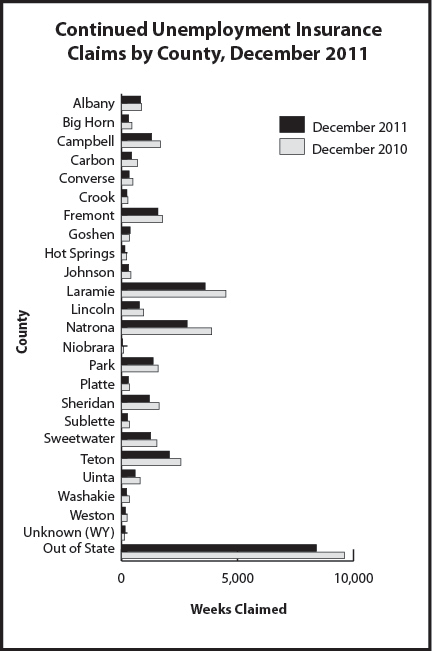
Continued claims slightly increased compared to November 2011 (16.7%) and declined 18.6% over the year. Benefit exhaustions (602) were 18.3% less than at this time last year.
| Continued Claims | Continued Weeks Claimed | Percent Change Weeks Claimed | ||||
|---|---|---|---|---|---|---|
| Dec 11 | Dec 11 | |||||
| Dec 11 | Nov 11 | Dec 10 | Nov 11 | Dec 10 | ||
| Wyoming Statewide | ||||||
| TOTAL WEEKS CLAIMED | 29,010 | 24,859 | 35,654 | 16.7 | -18.6 | |
| EXTENDED WEEKS CLAIMED | 10,633 | 10,842 | 18,852 | -1.9 | -43.6 | |
| TOTAL UNIQUE CLAIMANTSb | 8,652 | 6,349 | 8,903 | 36.3 | -2.8 | |
| Benefit Exhaustions | 602 | 541 | 737 | 11.3 | -18.3 | |
| Benefit Exhaustion Rates | 7.0% | 8.5% | 8.3% | -1.6% | -1.3% | |
| TOTAL GOODS-PRODUCING | 8,463 | 5,419 | 11,390 | 56.2 | -25.7 | |
| Natural Res. & Mining | 1,251 | 1,009 | 1,582 | 24.0 | -20.9 | |
| Mining | 1,016 | 844 | 1,328 | 20.4 | -23.5 | |
| Oil & Gas Extraction | 111 | 111 | 103 | 0.0 | 7.8 | |
| Construction | 6,426 | 3,754 | 8,953 | 71.2 | -28.2 | |
| Manufacturing | 786 | 656 | 855 | 19.8 | -8.1 | |
| TOTAL SERVICE-PROVIDING | 13,563 | 13,774 | 16,830 | -1.5 | -19.4 | |
| Trade, Transp., & Utilities | 3,229 | 3,059 | 4,391 | 5.6 | -26.5 | |
| Wholesale Trade | 507 | 421 | 558 | 20.4 | -9.1 | |
| Retail Trade | 1,876 | 1,814 | 2,827 | 3.4 | -33.6 | |
| Transp., Warehousing & Utilities | 846 | 824 | 1,006 | 2.7 | -15.9 | |
| Information | 172 | 167 | 168 | 3.0 | 2.4 | |
| Financial Activities | 670 | 666 | 792 | 0.6 | -15.4 | |
| Prof. & Business Services | 2,278 | 1,723 | 2,793 | 32.2 | -18.4 | |
| Educational & Health Svcs. | 1,351 | 1,377 | 1,709 | -1.9 | -20.9 | |
| Leisure and Hospitality | 5,280 | 6,287 | 6,305 | -16.0 | -16.3 | |
| Other Svcs., exc. Public Admin. | 583 | 495 | 672 | 17.8 | -13.2 | |
| TOTAL GOVERNMENT | 3,065 | 2,648 | 3,909 | 15.7 | -21.6 | |
| Federal Government | 1,574 | 1,144 | 2,229 | 37.6 | -29.4 | |
| State Government | 312 | 331 | 258 | -5.7 | 20.9 | |
| Local Government | 1,179 | 1,173 | 1,422 | 0.5 | -17.1 | |
| Local Education | 268 | 284 | 336 | -5.6 | -20.2 | |
| UNCLASSIFIED | 3,919 | 3,018 | 3,525 | 29.9 | 11.2 | |
| Laramie County | ||||||
| TOTAL WEEKS CLAIMED | 3,603 | 2,823 | 4,496 | 27.6 | -19.9 | |
| TOTAL UNIQUE CLAIMANTS | 1,094 | 744 | 1,136 | 47.0 | -3.7 | |
| TOTAL GOODS-PRODUCING | 1,263 | 714 | 1,655 | 76.9 | -23.7 | |
| Construction | 1,123 | 615 | 1,499 | 82.6 | -25.1 | |
| TOTAL SERVICE-PROVIDING | 1,782 | 1,596 | 2,113 | 11.7 | -15.7 | |
| Trade, Transp., and Utilities | 573 | 448 | 611 | 27.9 | -6.2 | |
| Financial Activities | 164 | 166 | 149 | -1.2 | 10.1 | |
| Prof. & Business Svcs. | 460 | 343 | 497 | 34.1 | -7.4 | |
| Educational and Health Svcs. | 239 | 273 | 426 | -12.5 | -43.9 | |
| Leisure & Hospitality | 231 | 244 | 293 | -5.3 | -21.2 | |
| TOTAL GOVERNMENT | 371 | 377 | 569 | -1.6 | -34.8 | |
| UNCLASSIFIED | 187 | 136 | 159 | 37.5 | 17.6 | |
| Natrona County | ||||||
| TOTAL WEEKS CLAIMED | 2,827 | 2,248 | 3,887 | 25.8 | -27.3 | |
| TOTAL UNIQUE CLAIMANTS | 839 | 578 | 953 | 45.2 | -12.0 | |
| TOTAL GOODS-PRODUCING | 999 | 733 | 1,154 | 36.3 | -13.4 | |
| Construction | 780 | 481 | 830 | 62.2 | -6.0 | |
| TOTAL SERVICE-PROVIDING | 1,565 | 1,300 | 2,386 | 20.4 | -34.4 | |
| Trade, Transp., and Utilities | 462 | 391 | 1,004 | 18.2 | -54.0 | |
| Financial Activities | 90 | 92 | 107 | -2.2 | -15.9 | |
| Professional & Business Svcs. | 307 | 221 | 401 | 38.9 | -23.4 | |
| Educational & Health Svcs. | 303 | 292 | 326 | 3.8 | -7.1 | |
| Leisure & Hospitality | 263 | 188 | 392 | 39.9 | -32.9 | |
| TOTAL GOVERNMENT | 187 | 157 | 285 | 19.1 | -34.4 | |
| UNCLASSIFIED | 76 | 58 | 62 | 31.0 | 22.6 | |
| aAn average month is considered 4.33 weeks. If a month has four weeks, the normalization factor is 1.0825. If the month has five weeks, the normalization factor is 0.866. The number of raw claims is multiplied by the normalization factor to achieve the normalized claims counts. bDoes not include claimants receiving extended benefits. | ||||||
|
| ||||||
|
| ||||||


