
Local Jobs and Payroll in Wyoming: Construction
Continues to Grow in 2012Q2
See Related Tables and Figures
The purpose of this article is to illustrate and describe employment and payroll changes between second quarter 2011 and second quarter 2012. These economic changes help gauge the overall strength of Wyoming's economy and identify the fastest and slowest growing sectors and geographic areas.
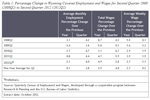 |
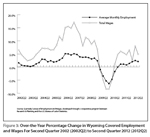
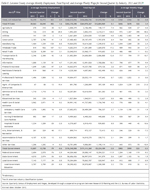
Total unemployment insurance (UI) covered payroll increased by $142.7 million (4.9%) in second quarter 2012 (2012Q2) compared to second quarter 2011 (2011Q2). Employment rose by 5,701 jobs (2.1%) and average weekly wage increased by $22 (2.7%). Job growth in second quarter was higher than its five-year average (2.1% compared to 0.1%; see Table 1). Total wages and average weekly wage also grew faster than their five-year averages. In terms of dollars, UI covered payroll represents approximately 91.5% of all wage and salary disbursements and 43.8% of personal income in the state (U.S. Bureau of Economic Analysis, 2013). Analysts have noted that "minerals related employment is one of the key predictors of sales and use tax revenue" in Wyoming (CREG 2010).
Despite the recent growth, overall employment remains approximately 6,900 jobs (2.4%) below its second quarter 2008 level. In other words, the state has yet to recoup all the job losses of 2009 and 2010.
The covered payroll and employment data in this article are tabulated by place of work, in contrast to the labor force estimates, which are a measure of employed and unemployed persons by place of residence. Also, the employment data presented in this article represent a count of jobs, not persons. When individuals work more than one job, each job is counted separately. Finally, job growth (or decline) is stated in terms of net change. The Quarterly Turnover Statistics by Industry table presents alternative measures of job gains and losses using the same data sources and calculated to describe the components of change.
 |
 |
 |
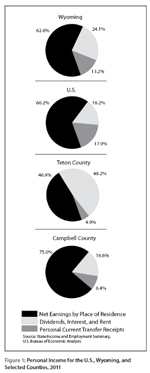
Wages and salaries are only one component of personal income. Figure 1 shows personal income in 2011 broken into three broad categories. For Wyoming, the largest category is net earnings (62.6% of personal income; U.S. Bureau of Economic Analysis, 2013). This includes wages, salaries, proprietor's income, and supplements to wages & salaries, such as employer-paid benefits. Dividends, interest, and rent make up 24.1% of personal income in Wyoming. Personal current transfer receipts account for 13.2% of Wyoming personal income and include Social Security, Medicare, Medicaid, unemployment insurance, veterans' benefits, and other transfer payments.
Comparing Wyoming's personal income to the U.S. reveals that a smaller portion of U.S. personal income comes from dividends, interest, and rent (16.2%), while a larger portion comes from transfer payments (17.9%). Transfer payments make up only 4.9% of the total in Teton County, while dividends, interest, and rent is the largest category (48.2%).
Net earnings are much less important to Teton County (46.9%) than they are to Wyoming or the U.S., which suggests that a given increase (or decrease) in wages in Teton County is likely to have a smaller economic impact than it would in most other counties. The fact that dividends, interest, and rent make up the largest portion of Teton County's personal income may at least partially be explained by the high-income households who live in that area of the state.
In Campbell County, net earnings account for three-fourths of personal income, a much higher proportion than in other areas. Transfer payments make up a relatively small portion of personal income (8.4%), possibly because the county's residents are younger on average than Wyoming residents in general. Dividends, interest, and rent account for the remaining 16.6% of personal income.
|
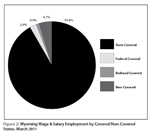
Figure 2 shows Wyoming wage & salary employment by covered/non-covered status. Approximately 92% of wage & salary jobs in the state are covered by state unemployment insurance, while 2.6% of jobs are covered by federal unemployment insurance, and 0.9% are covered by unemployment insurance administered by the railroad retirement board. There are several categories of non-covered jobs, and together they account for approximately 5% of wage & salary jobs in the state. Some examples of non-covered employment include elected officials, students working at educational institutions, employees of churches, and workers at small non-profit organizations.
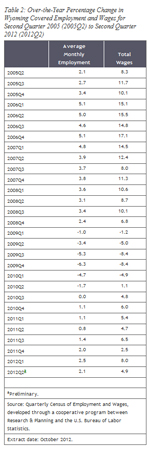
Job growth slowed slightly from 2.5% in first quarter to 2.1% in second quarter (see Table 2). Figure 3 shows that total payroll growth also slowed in second quarter, falling from 8.0% to 4.9%.
Employment and Wages by County
Employment increased in 18 counties and fell in five counties (see Table 3). Total payroll grew in 19 counties and declined in four counties.
Teton County added 735 jobs (4.5%) and its total payroll grew by $7.4 million (4.8%). The largest job gains occurred in accommodation & food services (more than 200 jobs), construction (nearly 200 jobs), arts, entertainment & recreation (more than 50 jobs), and transportation & warehousing (more than 50 jobs).
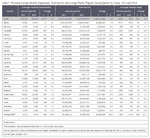 |
Campbell County gained 557 jobs (2.0%) and its total payroll rose by $7.4 million (2.0%). Substantial growth was seen in mining (including oil & gas; more than 250 jobs), utilities (nearly 100 jobs), local government (including public schools and hospitals; nearly 100 jobs), and wholesale trade (approximately 50 jobs).
Employment in Park County grew by 501 jobs (3.6%) and its total payroll increased by $9.8 million (8.0%). Growth was seen in construction (nearly 100 jobs), accommodation & food services (nearly 100 jobs), mining (including oil & gas; nearly 100 jobs), and local government (including public schools, colleges, & hospitals; nearly 100 jobs).
Converse County added 465 jobs (8.4%) and its total payroll rose by $7.4 million (12.2%). Mining (including oil & gas) added the most jobs (more than 100). Employment also increased in construction (approximately 100 jobs), accommodation & food services (approximately 100 jobs) and local government (approximately 50 jobs).
Lincoln County lost 474 jobs (-7.5%) and its total payroll fell by $2.2 million (-3.2%). Construction employment fell by more than 350 jobs, and mining (including oil & gas) fell by nearly 100 jobs. Smaller job losses were seen in accommodation & food services, transportation & warehousing, finance & insurance, and other sectors.
Employment fell by 70 jobs (-1.7%) but total payroll increased by $1.8 million (4.9%) in Washakie County. Job losses were seen in manufacturing, finance & insurance, and professional & technical services.
Sublette County lost 70 jobs (-1.2%) and its total payroll fell by $1.7 million (-2.1%). Employment fell in transportation & warehousing, mining (including oil & gas), and wholesale trade.
 |
 |
Natrona County gained 1,686 jobs (4.3%) and its total payroll grew by $36.6 million (8.3%). Sizable job gains occurred in wholesale trade (315 jobs, or 12.8%), construction (291 jobs, or 11.2%), other services (164 jobs, or 8.7%), mining (including oil & gas; 149 jobs, or 4.0%), and transportation & warehousing (148 jobs, or 15.2%). Employment fell in health care & social assistance (-81 jobs, or -1.4%).
Laramie County gained 403 jobs (0.9%) and its total payroll increased by $7.6 million (1.8%). Notable job gains were seen in retail trade (161 jobs, or 3.1%), wholesale trade (107 jobs, or 13.1%), and mining (including oil & gas; 88 jobs, or 69.8%). Job losses occurred in manufacturing (-125 jobs, or -8.5%), federal government (-76 jobs, or -2.9%), finance & insurance (-47 jobs, or -2.9%), and state government (-36 jobs, or -0.9%).
Statewide Employment and Wages by Industry
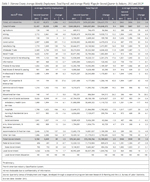
When viewed from an industry perspective, the largest job gains occurred in construction, mining (including oil & gas), accommodation & food services, and local government (including public schools, colleges, & hospitals; see Table 4). Employment fell in federal government, state government, utilities, and health care & social assistance.
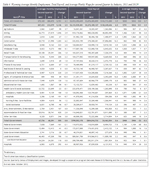 |
For the second consecutive quarter, Wyoming's construction sector grew, adding 1,283 jobs (6.2%) and $37.9 million in payroll (16.3%). Construction of buildings added more than 100 jobs, heavy & civil engineering construction added more than 800 jobs, and specialty trade contractors added more than 300 jobs.
Mining employment increased by 1,046 jobs (3.9%) and its total payroll rose by $40.1 million (7.9%). Oil & gas extraction added more than 200 jobs, mining, except oil & gas added approximately 200 jobs, and support activities for mining added approximately 600 jobs. Job gains in mining have been steadily getting smaller each quarter.
Accommodation & food services added 825 jobs (2.8%) and its total payroll grew by $5.9 million (5.1%). Accommodation gained more than 200 jobs and food services & drinking places gained nearly 600 jobs.
Local government employment grew by 755 jobs (1.6%) and its total payroll rose by $11.0 million (2.2%). Hospitals added 292 jobs (4.4%) and local government education (including public schools & colleges) added 118 jobs (0.5%). Approximately 200 jobs were added in public administration (including cities, towns, and counties).
Federal government employment fell by 161 jobs (-2.1%), and its total payroll decreased by $9.0 million (-7.5%). Modest job losses were seen in many different federal agencies.
State government lost 41 jobs (-0.3%), but its total payroll grew by $2.4 million (1.4%). Employment fell slightly across several state institutions and agencies.
Employment in the utilities sector fell by 27 jobs (-1.1%) and its total payroll decreased by $1.5 million (-2.8%). It appears that most of the job losses were in electric power generation and supply.
Health care & social assistance lost 23 jobs (-0.1%), but its total payroll rose by $1.3 million (0.5%). Large job losses at private hospitals (-191 jobs, or -5.7%) were partially offset by job gains in ambulatory health care services (158 jobs, or 1.8%).
In summary, the construction sector continued to add jobs in second quarter while job gains in mining (including oil & gas) slowed from their pace in 2011. Job losses in health care & social assistance moderated somewhat from first quarter.
References
Consensus Revenue Estimating Group (CREG; 2010, October). Wyoming state government revenue forecast fiscal year 2011-fiscal year 2016. Retrieved February 17, 2011 from http://eadiv.state.wy.us/creg/GreenCREG_Oct10.pdf
U.S. Bureau of Economic Analysis. (2013, January 16). SA04 State income and employment summary. Retrieved January 16, 2013, from http://www.bea.gov/iTable/iTable.cfm?ReqID=70&step=1&isuri=1&acrdn=4