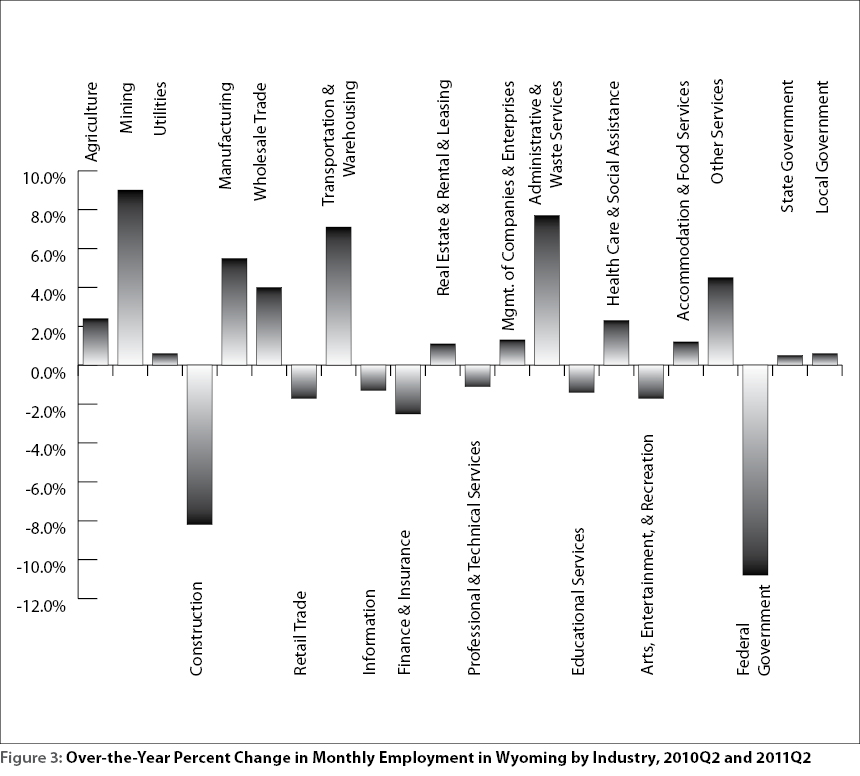
Local Jobs and Payroll in Wyoming: Construction Sector Sheds Jobs in Second Quarter 2011; Mining Shows Gains
(Tables and Figures)
See Related Article
Tables 1, 2, 3, 4
Figures 1, 2, 3
| Average Monthly Employment Percentage Change Over the Previous |
Total Wages Percentage Change Over the Previous |
Average Weekly Wage Percentage Change Over the Previous |
||||
|---|---|---|---|---|---|---|
| Year | Quarter | Year | Quarter | Year | Quarter | |
| 2007Q2 | 3.9 | 4.7 | 12.4 | 6.2 | 8.1 | 1.3 |
| 2008Q2 | 3.1 | 4.2 | 8.7 | 4.3 | 5.5 | 0.1 |
| 2009Q2 | -3.4 | 1.6 | -5.0 | 0.3 | -1.6 | -1.3 |
| 2010Q2 | -1.7 | 4.7 | 1.1 | 6.7 | 2.9 | 1.9 |
| 2011Q2a | 0.8 | 4.4 | 4.6 | 5.9 | 3.7 | 1.4 |
| Five-Year Average for Q2 | 0.5 | 3.9 | 4.4 | 4.7 | 3.7 | 0.7 |
| aPreliminary. | ||||||
| Source: Quarterly Census of Employment and Wages, developed through a cooperative program between Research & Planning and the U.S. Bureau of Labor Statistics. | ||||||
| Extract date: October 2011. | ||||||
| Average Monthly Employment | Total Wages | |
|---|---|---|
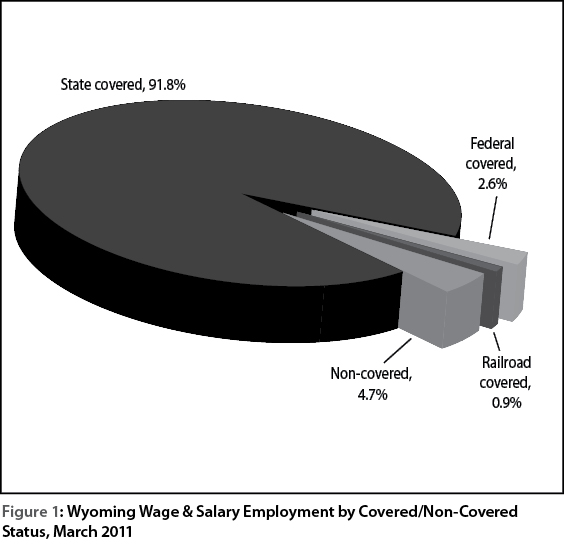
| 2004Q2 | 2.9 | 7.1 |
| 2004Q3 | 2.0 | 7.1 |
| 2004Q4 | 2.4 | 6.5 |
| 2005Q1 | 1.9 | 6.6 |
| 2005Q2 | 2.1 | 8.3 |
| 2005Q3 | 2.7 | 11.7 |
| 2005Q4 | 3.4 | 10.1 |
| 2006Q1 | 5.1 | 15.1 |
| 2006Q2 | 5.0 | 15.5 |
| 2006Q3 | 4.6 | 14.8 |
| 2006Q4 | 5.1 | 17.1 |
| 2007Q1 | 4.8 | 14.5 |
| 2007Q2 | 3.9 | 12.4 |
| 2007Q3 | 3.7 | 8.0 |
| 2007Q4 | 3.8 | 11.3 |
| 2008Q1 | 3.6 | 10.6 |
| 2008Q2 | 3.1 | 8.7 |
| 2008Q3 | 3.4 | 10.1 |
| 2008Q4 | 2.4 | 6.8 |
| 2009Q1 | -1.0 | -1.2 |
| 2009Q2 | -3.4 | -5.0 |
| 2009Q3 | -5.3 | -8.4 |
| 2009Q4 | -6.3 | -8.4 |
| 2010Q1 | -4.7 | -4.9 |
| 2010Q2 | -1.7 | 1.1 |
| 2010Q3 | 0.0 | 4.8 |
| 2010Q4 | 1.1 | 6.0 |
| 2011Q1 | 1.1 | 5.4 |
| 2011Q2a | 0.8 | 4.6 |
| aPreliminary. | ||
| Source: Quarterly Census of Employment and Wages, developed through a cooperative program between Research & Planning and the U.S. Bureau of Labor Statistics. | ||
| Extract date: October 2011. | ||
| Average Monthly Employment | Total Payroll | Average Weekly Wage | ||||||||||
|---|---|---|---|---|---|---|---|---|---|---|---|---|
| County | Second Quarter | Change | Second Quarter | Change | Second Quarter | Change | ||||||
| 2010 | 2011 | n | % | 2010 | 2011 | $ | % | 2010 | 2011 | $ | % | |
| Total | 273,044 | 275,271 | 2,227 | 0.8 | $2,802,848,365 | $2,932,597,067 | $129,748,702 | 4.6 | $790 | $819 | $29 | 3.7 |
| Albany | 15,255 | 15,445 | 190 | 1.2 | $141,114,566 | $143,187,541 | $2,072,975 | 1.5 | $712 | $713 | $1 | 0.1 |
| Big Horn | 4,252 | 4,383 | 131 | 3.1 | 37,028,418 | 38,644,314 | 1,615,896 | 4.4 | 670 | 678 | 8 | 1.2 |
| Campbell | 27,755 | 27,524 | -231 | -0.8 | 359,209,563 | 369,452,990 | 10,243,427 | 2.9 | 996 | 1,033 | 37 | 3.7 |
| Carbon | 7,027 | 6,662 | -365 | -5.2 | 69,595,490 | 64,895,853 | -4,699,637 | -6.8 | 762 | 749 | -13 | -1.7 |
| Converse | 5,512 | 5,509 | -3 | -0.1 | 60,516,237 | 61,053,155 | 536,918 | 0.9 | 845 | 852 | 7 | 0.8 |
| Crook | 2,433 | 2,375 | -58 | -2.4 | 21,032,173 | 21,056,264 | 24,091 | 0.1 | 665 | 682 | 17 | 2.6 |
| Fremont | 16,412 | 16,668 | 256 | 1.6 | 150,504,032 | 157,801,780 | 7,297,748 | 4.8 | 705 | 728 | 23 | 3.3 |
| Goshen | 4,550 | 4,593 | 43 | 0.9 | 34,497,084 | 36,760,207 | 2,263,123 | 6.6 | 583 | 616 | 33 | 5.7 |
| Hot Springs | 2,166 | 2,176 | 10 | 0.5 | 16,076,037 | 17,433,885 | 1,357,848 | 8.4 | 571 | 616 | 45 | 7.9 |
| Johnson | 3,315 | 3,315 | 0 | 0.0 | 25,252,470 | 26,006,837 | 754,367 | 3.0 | 586 | 603 | 17 | 2.9 |
| Laramie | 42,521 | 43,346 | 825 | 1.9 | 410,889,645 | 428,172,542 | 17,282,897 | 4.2 | 743 | 760 | 17 | 2.3 |
| Lincoln | 6,091 | 6,272 | 181 | 3.0 | 57,024,133 | 68,833,677 | 11,809,544 | 20.7 | 720 | 844 | 124 | 17.2 |
| Natrona | 38,088 | 39,178 | 1,090 | 2.9 | 401,332,149 | 439,058,435 | 37,726,286 | 9.4 | 811 | 862 | 51 | 6.3 |
| Niobrara | 885 | 909 | 24 | 2.7 | 6,745,029 | 7,251,148 | 506,119 | 7.5 | 586 | 614 | 28 | 4.8 |
| Park | 13,746 | 13,986 | 240 | 1.7 | 118,728,332 | 123,222,394 | 4,494,062 | 3.8 | 664 | 678 | 14 | 2.1 |
| Platte | 3,762 | 3,746 | -16 | -0.4 | 40,477,993 | 41,326,842 | 848,849 | 2.1 | 828 | 849 | 21 | 2.5 |
| Sheridan | 13,189 | 12,915 | -274 | -2.1 | 119,281,581 | 119,073,686 | -207,895 | -0.2 | 696 | 709 | 13 | 1.9 |
| Sublette | 5,586 | 5,741 | 155 | 2.8 | 76,216,131 | 82,204,622 | 5,988,491 | 7.9 | 1,050 | 1,101 | 51 | 4.9 |
| Sweetwater | 23,982 | 24,668 | 686 | 2.9 | 309,671,042 | 335,593,030 | 25,921,988 | 8.4 | 993 | 1,046 | 53 | 5.3 |
| Teton | 16,599 | 16,284 | -315 | -1.9 | 147,225,777 | 152,535,500 | 5,309,723 | 3.6 | 682 | 721 | 39 | 5.7 |
| Uinta | 9,154 | 8,944 | -210 | -2.3 | 91,914,613 | 87,132,806 | -4,781,807 | -5.2 | 772 | 749 | -23 | -3.0 |
| Washakie | 4,001 | 4,023 | 22 | 0.5 | 35,203,581 | 37,044,911 | 1,841,330 | 5.2 | 677 | 708 | 31 | 4.6 |
| Weston | 2,352 | 2,286 | -66 | -2.8 | 21,054,852 | 22,560,853 | 1,506,001 | 7.2 | 689 | 759 | 70 | 10.2 |
| Nonclassifiedb | 4,409 | 4,323 | -86 | -2.0 | 52,257,437 | 52,293,795 | 36,358 | 0.1 | 912 | 931 | 19 | 2.1 |
| aPreliminary. | ||||||||||||
| bThe employer may be located statewide or in more than one county. | ||||||||||||
| Source: Quarterly Census of Employment and Wages, developed through a cooperative program between Research & Planning and the U.S. Bureau of Labor Statistics. | ||||||||||||
| Extract date: October 2011. | ||||||||||||
| Average Monthly Employment | Total Payroll | Average Weekly Wage | ||||||||||
|---|---|---|---|---|---|---|---|---|---|---|---|---|
| Second Quarter | Change | Second Quarter | Change | Second Quarter | Change | |||||||
| NAICSb Title | 2010 | 2011 | n | % | 2010 | 2011 | $ | % | 2010 | 2011 | $ | % |
| Total, All Industries | 273,044 | 275,271 | 2,227 | 0.8 | $2,802,848,365 | $2,932,597,067 | $129,748,702 | 4.6 | $790 | $819 | $29 | 3.7 |
| Total Private | 204,708 | 207,529 | 2,821 | 1.4 | $2,015,278,842 | $2,133,003,849 | $117,725,007 | 5.8 | $757 | $791 | $34 | 4.5 |
| Agriculture | 2,497 | 2,557 | 60 | 2.4 | 16,350,571 | 16,829,665 | 479,094 | 2.9 | 504 | 506 | 2 | 0.4 |
| Mining | 24,562 | 26,779 | 2,217 | 9.0 | 447,465,110 | 510,276,387 | 62,811,277 | 14.0 | 1,401 | 1,466 | 65 | 4.6 |
| Utilities | 2,494 | 2,510 | 16 | 0.6 | 51,348,027 | 51,952,135 | 604,108 | 1.2 | 1,584 | 1,592 | 8 | 0.5 |
| Construction | 22,556 | 20,701 | -1,855 | -8.2 | 256,095,442 | 232,412,366 | -23,683,076 | -9.2 | 873 | 864 | -9 | -1.0 |
| Manufacturing | 8,472 | 8,942 | 470 | 5.5 | 108,157,608 | 120,102,245 | 11,944,637 | 11.0 | 982 | 1,033 | 51 | 5.2 |
| Wholesale Trade | 8,469 | 8,810 | 341 | 4.0 | 106,384,902 | 116,786,504 | 10,401,602 | 9.8 | 966 | 1,020 | 54 | 5.6 |
| Retail Trade | 29,594 | 29,085 | -509 | -1.7 | 184,542,957 | 182,885,712 | -1,657,245 | -0.9 | 480 | 484 | 4 | 0.8 |
| Transportation & Warehousing | 8,619 | 9,233 | 614 | 7.1 | 92,613,684 | 104,401,019 | 11,787,335 | 12.7 | 827 | 870 | 43 | 5.2 |
| Information | 3,895 | 3,846 | -49 | -1.3 | 35,994,558 | 37,658,500 | 1,663,942 | 4.6 | 711 | 753 | 42 | 5.9 |
| Finance & Insurance | 6,886 | 6,716 | -170 | -2.5 | 77,583,552 | 78,225,123 | 641,571 | 0.8 | 867 | 896 | 29 | 3.3 |
| Real Estate & Rental & Leasing | 3,983 | 4,025 | 42 | 1.1 | 35,713,838 | 43,698,355 | 7,984,517 | 22.4 | 690 | 835 | 145 | 21.0 |
| Professional & Technical Services | 9,079 | 8,982 | -97 | -1.1 | 112,214,359 | 116,978,741 | 4,764,382 | 4.2 | 951 | 1,002 | 51 | 5.4 |
| Mgmt. of Companies & Enterprises | 857 | 868 | 11 | 1.3 | 21,221,186 | 21,314,499 | 93,313 | 0.4 | 1,905 | 1,889 | -16 | -0.8 |
| Administrative & Waste Services | 7,372 | 7,941 | 569 | 7.7 | 49,446,749 | 57,030,164 | 7,583,415 | 15.3 | 516 | 552 | 36 | 7.0 |
| Educational Services | 1,669 | 1,646 | -23 | -1.4 | 11,134,915 | 12,076,289 | 941,374 | 8.5 | 513 | 564 | 51 | 9.9 |
| Health Care & Social Assistance | 23,193 | 23,716 | 523 | 2.3 | 218,610,752 | 233,855,294 | 15,244,542 | 7.0 | 725 | 759 | 34 | 4.7 |
| Ambulatory Health Care Services | 8,697 | 8,977 | 280 | 3.2 | 117,478,558 | 125,029,577 | 7,551,019 | 6.4 | 1,039 | 1,071 | 32 | 3.1 |
| Hospitals | 3,278 | 3,356 | 78 | 2.4 | 36,325,822 | 41,570,842 | 5,245,020 | 14.4 | 852 | 953 | 101 | 11.9 |
| Nursing & Res. Care Facilities | 4,538 | 4,553 | 15 | 0.3 | 31,324,266 | 31,985,732 | 661,466 | 2.1 | 531 | 540 | 9 | 1.7 |
| Social Assistance | 6,679 | 6,830 | 151 | 2.3 | 33,482,106 | 35,269,143 | 1,787,037 | 5.3 | 386 | 397 | 11 | 2.8 |
| Arts, Entertainment, & Recreation | 2,820 | 2,771 | -49 | -1.7 | 11,540,527 | 11,394,758 | -145,769 | -1.3 | 315 | 316 | 1 | 0.3 |
| Accommodation & Food Services | 29,746 | 30,095 | 349 | 1.2 | 112,483,818 | 116,684,058 | 4,200,240 | 3.7 | 291 | 298 | 7 | 2.4 |
| Other Services | 7,948 | 8,306 | 358 | 4.5 | 66,376,287 | 68,442,035 | 2,065,748 | 3.1 | 642 | 634 | -8 | -1.2 |
| Total Government | 68,336 | 67,742 | -594 | -0.9 | $787,569,523 | $799,593,218 | $12,023,695 | 1.5 | $887 | $908 | $21 | 2.4 |
| Federal Government | 8,775 | 7,830 | -945 | -10.8 | 120,502,377 | 118,973,532 | -1,528,845 | -1.3 | 1,056 | 1,169 | 113 | 10.7 |
| State Government | 13,387 | 13,454 | 67 | 0.5 | 171,020,001 | 172,017,888 | 997,887 | 0.6 | 983 | 984 | 1 | 0.1 |
| State Government Education | 3,707 | 3,741 | 34 | 0.9 | 48,193,102 | 48,374,821 | 181,719 | 0.4 | 1,000 | 995 | -5 | -0.5 |
| Local Government | 46,175 | 46,458 | 283 | 0.6 | 496,047,145 | 508,601,798 | 12,554,653 | 2.5 | 826 | 842 | 16 | 1.9 |
| Local Government Education | 23,987 | 24,234 | 247 | 1.0 | 278,762,966 | 290,709,450 | 11,946,484 | 4.3 | 894 | 923 | 29 | 3.2 |
| Hospitals | 6,571 | 6,583 | 12 | 0.2 | 78,054,115 | 80,907,926 | 2,853,811 | 3.7 | 914 | 945 | 32 | 3.5 |
| aPreliminary. | ||||||||||||
| bNorth American Industry Classification System. | ||||||||||||
| Source: Quarterly Census of Employment and Wages, developed through a cooperative program between Research & Planning and the U.S. Bureau of Labor Statistics. | ||||||||||||
| Extract date: October 2011. | ||||||||||||