
The Survey of Occupational Injuries and Illnesses for 2009 and 2010 (Tables and Figures)
See Related Article
| Total Private Industryb,c,d | ||||||||
|---|---|---|---|---|---|---|---|---|
| 2003 | 2004 | 2005 | 2006 | 2007 | 2008 | 2009 | 2010 | |
| Total | 3,770 | 3,510 | 3,800 | 3,250 | 3,420 | 3,210 | 2,710 | 2,510 |
| Gender | ||||||||
| Males | 2,430 | 2,360 | 2,710 | 2,260 | 2,350 | 2,340 | 1,970 | 1,680 |
| Females | 1,280 | 1,100 | 1,060 | 950 | 1,020 | 810 | 710 | 800 |
| Age | ||||||||
| 16 to 19 | 260 | 150 | 200 | 120 | 230 | 180 | 100 | 60 |
| 20 to 24 | 520 | 560 | 520 | 470 | 470 | 470 | 460 | 280 |
| 25 to 34 | 810 | 780 | 910 | 730 | 840 | 640 | 730 | 600 |
| 35 to 44 | 880 | 800 | 890 | 750 | 730 | 780 | 480 | 520 |
| 45 to 54 | 910 | 660 | 830 | 750 | 650 | 670 | 570 | 630 |
| 55 to 64 | 320 | 420 | 370 | 340 | 420 | 370 | 280 | 330 |
| 65 and over | 60 | 140 | 80 | 100 | 80 | 100 | 90 | 90 |
| Length of service with employer | ||||||||
| Less than 3 months | 930 | 950 | 1,030 | 900 | 1,010 | 790 | 570 | 470 |
| 3 months to 11 months | 750 | 840 | 1,040 | 810 | 800 | 750 | 660 | 560 |
| 1 year to 5 years | 1,180 | 940 | 1,030 | 900 | 970 | 1,010 | 880 | 910 |
| More than 5 years | 840 | 740 | 670 | 600 | 590 | 590 | 560 | 540 |
| Number of days away from work | ||||||||
| Cases involving 1 day | 500 | 550 | 550 | 320 | 300 | 410 | 340 | 410 |
| Cases involving 2 days | 410 | 330 | 450 | 350 | 310 | 300 | 300 | 220 |
| Cases involving 3-5 days | 800 | 520 | 720 | 640 | 750 | 760 | 510 | 350 |
| Cases involving 6-10 days | 460 | 390 | 460 | 400 | 590 | 320 | 310 | 290 |
| Cases involving 11-20 days | 400 | 560 | 430 | 440 | 380 | 370 | 270 | 360 |
| Cases involving 21-30 days | 290 | 260 | 250 | 220 | 190 | 190 | 220 | 210 |
| Cases involving 31 or more days | 920 | 890 | 940 | 890 | 910 | 860 | 770 | 670 |
| Median days away from worke | 7 | 10 | 7 | 10 | 8 | 7 | 8 | 10 |
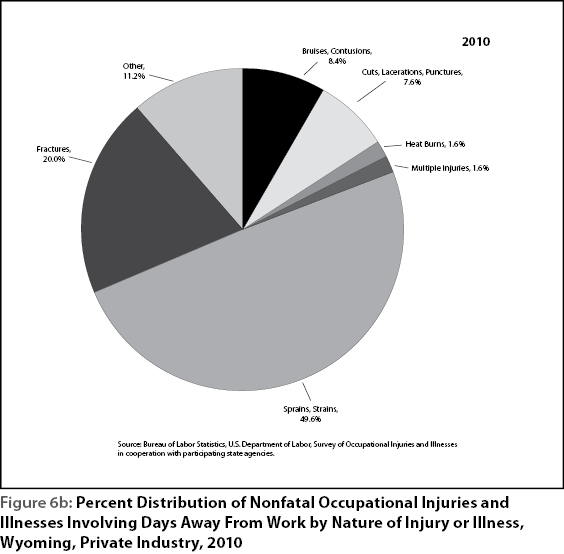
| Nature of injury, illness | ||||||||
| Sprains, strains | 2,080 | 1,630 | 1,880 | 1,600 | 1,590 | 1,520 | 1,250 | 1,240 |
| Fractures | 290 | 380 | 370 | 380 | 450 | 550 | 410 | 500 |
| Cuts, lacerations, punctures | 260 | 340 | 330 | 240 | 260 | 270 | 220 | 190 |
| Bruises, contusions | 360 | 200 | 390 | 490 | 320 | 310 | 320 | 210 |
| Heat burns | 60 | 110 | 110 | 50 | 100 | 40 | 50 | 40 |
| Chemical burns | -- | 30 | 30 | -- | -- | 20 | 20 | |
| Multiple traumatic injuries | 140 | 140 | 80 | 50 | 120 | 70 | 30 | 40 |
| Soreness, Pain | 90 | 70 | 40 | 30 | 30 | 20 | 30 | 20 |
| All other | 400 | 520 | 530 | 350 | 350 | 380 | 310 | 220 |
| Day of the week | ||||||||
| Sunday | 150 | 260 | 250 | 170 | 210 | 140 | 130 | 120 |
| Monday | 760 | 540 | 660 | 600 | 490 | 520 | 500 | 520 |
| Tuesday | 640 | 580 | 640 | 570 | 650 | 660 | 520 | 460 |
| Wednesday | 540 | 720 | 730 | 620 | 530 | 550 | 460 | 410 |
| Thursday | 660 | 560 | 680 | 530 | 720 | 590 | 430 | 350 |
| Friday | 630 | 550 | 600 | 520 | 590 | 520 | 360 | 440 |
| Saturday | 400 | 290 | 240 | 240 | 220 | 230 | 320 | 200 |
| aDays away from work include those that result in days away from work with or without job transfer or restriction. | ||||||||
| bExcludes farms with fewer than 11 employees. | ||||||||
| cData for mining (Sector 21 in the North American Industry Classification System -- United States, 2007) include establishments not governed by the Mine Safety and Health Administration (MSHA) rules and reporting, such as those in oil and gas extraction and related support activities. Data for mining operators in coal, metal, and nonmetal mining are provided to BLS by the Mine Safety and Health Administration, U.S. Department of Labor. Independent mining contractors are excluded from the coal, metal, and nonmetal mining industries. These data do not reflect the changes the Occupational Safety and Health Administration made to its recordkeeping requirements effective January 1, 2002; therefore estimates for these industries are not comparable to estimates in other industries. | ||||||||
| dData for employers in railroad transportation are provided to BLS by the Federal Railroad Administration, U.S. Department of Transportation. | ||||||||
| eMedian days away from work is the measure used to summarize the varying lengths of absences from work among the cases with days away from work. Half the cases involved more days and half involved less days than a specified median. Median days away from work are represented in actual values. | ||||||||
| Note: Because of rounding and data exclusion of nonclassifiable responses, data may not sum to the totals. Dashes indicate data that do not meet publication guidelines. The scientifically selected probability sample used was one of many possible samples, each of which could have produced different estimates. A measure of sampling variability for each estimate is available upon request. | ||||||||
| Source: Bureau of Labor Statistics, U.S. Department of Labor, Survey of Occupational Injuries and Illnesses in cooperation with participating state agencies. | ||||||||
| Occupation | 2007 | 2008 | 2009 | 2010 | ||||||||
|---|---|---|---|---|---|---|---|---|---|---|---|---|
| Total Cases: 3,420 | Total Cases: 3,210 | Total Cases: 2,710 | Total Cases: 2,510 | |||||||||
| OESb Employ-ment | Cases | RSEc | OESb Employ-ment | Cases | RSEc | OESb Employ-ment | Cases | RSEc | OESb Employ-ment |
Cases | RSEc | |
| Truck Drivers, Heavy & Tractor-trailer | 6,450 | 230 | 8.5 | 6,270 | 220 | 10.1 | 6,200 | 200 | 9.8 | 5,420 | 270 | 8.6 |
| Laborers & Freight, Stock, & Material Movers, Hand | 3,230 | 310 | 7.8 | 3,440 | 210 | 10.3 | 3,110 | 180 | 10.2 | 3,070 | 120 | 11.5 |
| Nursing Aides, Orderlies, & Attendants | 3,080 | 70 | 13.2 | 3,070 | 90 | 14.2 | 2,990 | 90 | 13.4 | 2,970 | 100 | 12.0 |
| Extraction Workers, All Other | 1,480 | 140 | 10.3 | 1,590 | 130 | 12.2 | 1,490 | 80 | 14.5 | 770 | 100 | 12.2 |
| Carpenters | 3,140 | 60 | 14.4 | 3,100 | 150 | 11.6 | 3,020 | 120 | 11.9 | 2,630 | 100 | 12.2 |
| Industrial Machinery Mechanics | 1,720 | 80 | 12.9 | 2,000 | 60 | 16.9 | 2,210 | 40 | 18.8 | 1,900 | 80 | 13.5 |
| Truck Drivers, Light or Delivery Services | -- | 50 | 15.7 | 2,020 | 90 | 14.2 | 2,310 | 60 | 16.1 | 1,530 | 70 | 14.1 |
| Cashiers | 6,020 | 20 | 22.2 | 6,240 | 30 | 21.9 | 6,170 | 30 | 22.6 | 6,020 | 70 | 14.3 |
| Social & Human Service Assistants | 1,130 | 20 | 25.5 | 710 | 20 | 26.6 | 790 | 50 | 17.4 | 800 | 60 | 14.7 |
| Cooks, Restaurant | 2,340 | 120 | 10.7 | 2,510 | 130 | 12.2 | 2,450 | 30 | 23.2 | 2,260 | 60 | 15.2 |
| Construction Laborers | 2,730 | 240 | 8.4 | 2,960 | 200 | 10.5 | 2,830 | 130 | 11.8 | 2,550 | 50 | 15.8 |
| Waiters & Waitresses | 5,350 | -- | -- | 5,420 | -- | -- | 5,150 | 20 | 24.5 | 4,740 | 50 | 16.4 |
| Total | 36,670 | 1,340 | 39,330 | 1,330 | 38,720 | 1,030 | 34,660 | 1,130 | ||||
| aDays-away-from-work cases include those that result in days away from work with or without job transfer or restriction. | ||||||||||||
| bOccupational Employment Statistics; data includes all ownerships. | ||||||||||||
| cRelative Standard Error; according to the U.S. Bureau of Labor Statistics, “a measure of the reliability or precision of the employment estimate. The relative standard error is defined as the ratio of the standard error to the survey estimate. For example, a relative standard error of 10 percent implies that the standard error is one-tenth as large as the survey estimate.” Source: http://www.bls.gov/oes/current/oes_abo.htm | ||||||||||||
| Note: Dashes indicate data that are not available. | ||||||||||||
| Table created by Research & Planning, Wyoming Department of Workforce Services. | ||||||||||||
| Source: Bureau of Labor Statistics, U.S. Department of Labor, Survey of Occupational Injuries and Illnesses in cooperation with participating state agencies. | ||||||||||||