
Chapter 6 Supporting Documentation: Analysis of CIP Codes in Experimental and Control Groups in Hathaway Evaluation
To conduct a reliable evaluation of the Hathaway Scholarship Program (HSP), Research & Planning (R&P) matched University of Wyoming (UW) and Wyoming’s seven community college students to workplace outcomes using unemployment insurance (UI) wage records. Wage records represent an individual’s wage history based on employers’ quarterly wage and employment reports to the UI tax section of the Wyoming Department of Workforce Services (Gallagher, 2016). For this evaluation, the experimental group was comprised of students who predominantly funded their postsecondary education through the Hathaway Scholarship Program (HSP), meaning that 70% or more of all scholarships, grants, or other awards came from HSP. Comparison groups were then created using all other postsecondary education financing strategies. More information on studies using control groups and the control groups used in this study can be found in Chapters 6 and 7.
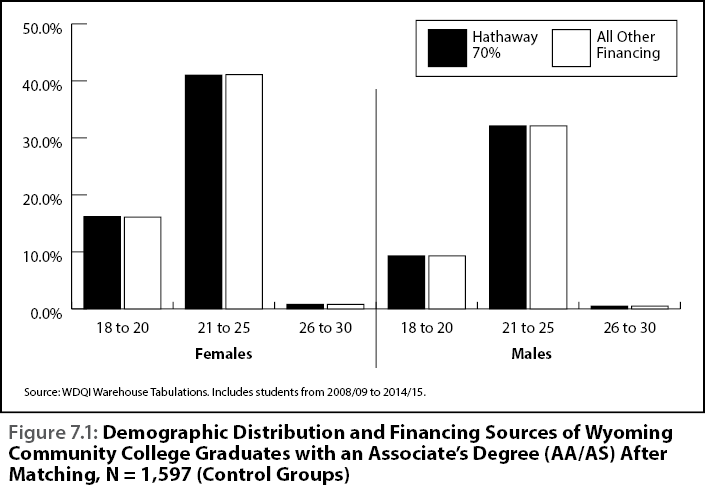
The comparison groups were matched based on age, gender, education institution, and work experience prior to graduation. Figures 7.1 and 7.2 in Chapter 7 show the distribution of the Hathaway 70% group and the All Other financing group by age and gender, showing that equal proportions from each age group and gender made up the experimental and control groups for the evaluation.
With little time to conduct and publish the HSP evaluation, R&P was unable to immediately examine the distributions of Classification of Instructional Programs (CIP) codes between the experimental and comparison groups for associate’s and bachelor’s degrees1. Without the CIP codes taken into account, the wages and retention of the experimental group could have been made up completely of one CIP code, while the wages and retention of the control group could have been made up of another CIP code, affecting of the results of the evaluation.
To determine the significance of the difference in the number of individuals who earned either an associate’s degree or bachelor’s degree by CIP code and financing strategy (Hathaway 70% or All Other), R&P used the chi square test. This particular type of analysis allows R&P to test the association of the difference between the observed and expected frequencies of the experimental and control groups (Harris, 2016) in this study, by CIP code. Although the experimental and control groups were not matched on CIP code, the desired outcome of the chi square test is to demonstrate that there is no statistically significant difference in the distribution of CIP codes between the Hathaway 70% and All Other groups.
|
|
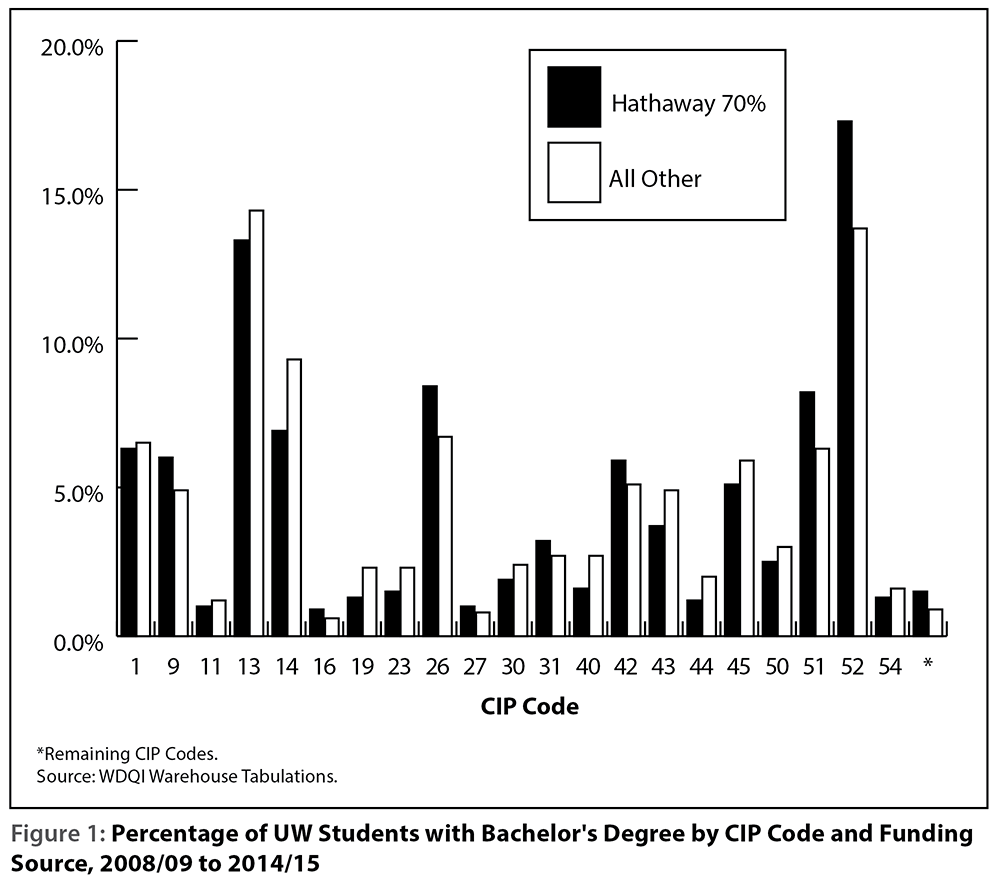
Figure 1 shows the distribution of UW students, either with 70% Hathaway funding or All Other funding with a bachelor’s degree by CIP code. The Remaining CIPs in the figures are CIP codes containing fewer than five graduates, collapsed for confidentiality. At the p=.05 significance level, the χ2 value of 30.426 is less than the test value of 32.67 with 21 degrees of freedom and shows that there is no statistically significant difference between the frequencies of the Hathaway 70% experimental group and the All Other control group with bachelor’s degrees from UW.
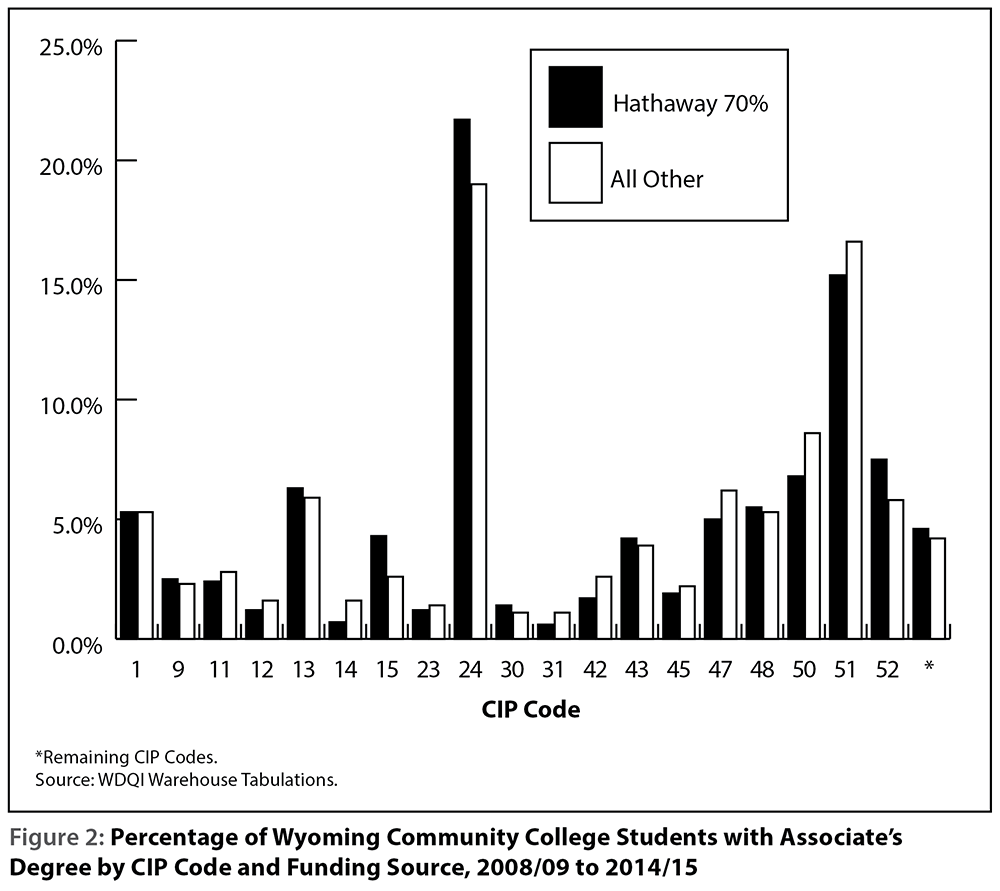
Similarly, Figure 2 shows the frequencies of associate’s degrees by CIP code from the seven community colleges in Wyoming. The χ2 value of 15.667 is less than the critical value at the p=.05 significance level of 30.14 with 19 degrees of freedom, indicating that there is also no statistically significant difference between the frequencies of the experimental and control groups with associate’s degrees.
|
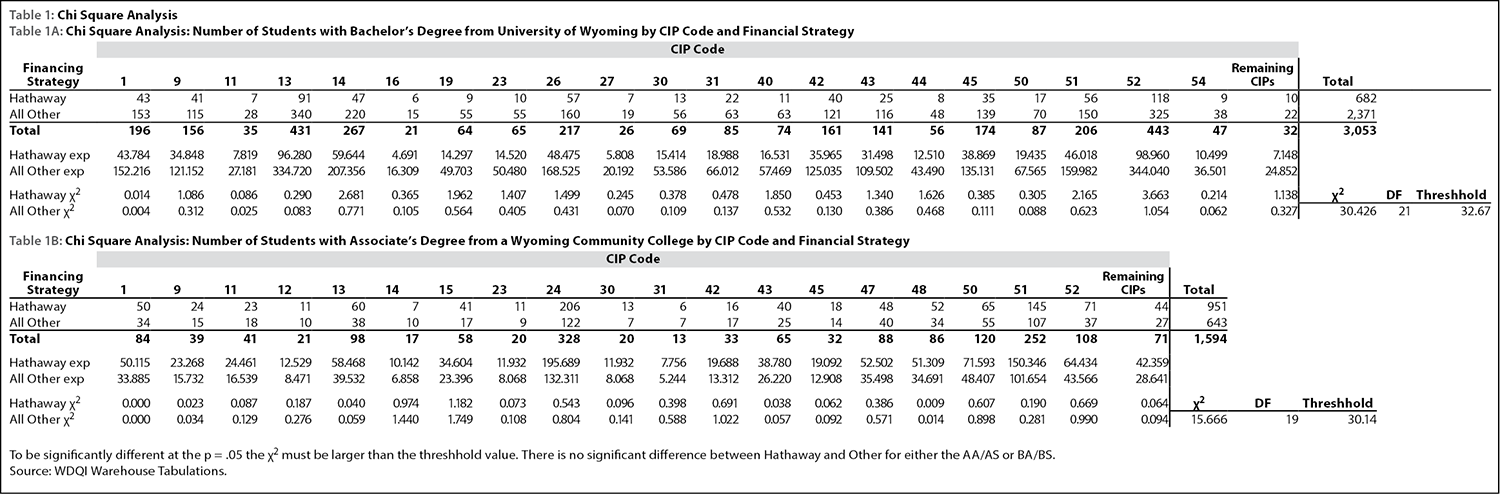
Tables 1a and 1b show the calculations of the chi square analysis for graduates with bachelor’s degrees from UW and associate’s degrees from the community colleges, respectively, including the observed and expected frequencies of each CIP code.
Even though the experimental and control groups of R&P’s quasi-experimental study of the Hathaway Scholarship were not matched on CIP code, the lack of a statistically significant difference in the distribution of students with degrees by CIP code between the groups increases the reliability in understanding the various paths of Hathaway scholars and students who did not receive Hathaway funding. Without a similar distribution among CIP codes between the groups, there is less confidence in the wage and retention data in the evaluation. Further research will include whether a degree in certain CIP codes increases the chances of leaving Wyoming for work in other states.
References
Gallagher, T. (2016). Chapter 1: Introduction. Wyoming’s Hathaway Scholarship Program: A Workforce Outcomes Evaluation of a State Merit-Based Scholarship Initiative Using Administrative Records. p. 4. Retrieved June 28, 2016, from http://doe.state.wy.us/LMI/education_we_connect/hathaway2016/hathaway_ch1.htm
Harris, P. (2016). Chapter 7: Postsecondary employment and wage outcomes: Controlling for age, gender, and work experience. Wyoming’s Hathaway Scholarship Program: A Workforce Outcomes Evaluation of a State Merit-Based Scholarship Initiative Using Administrative Records. p. 50. Retrieved June 28, 2016, from http://doe.state.wy.us/LMI/education_we_connect/hathaway2016/hathaway_ch7.htm
1See Chapter 5 for an introduction to CIP codes.