There are several different methods of analyzing labor market information to produce estimates of employment. The most common are those conducted by state research offices in cooperation with the U.S. Bureau of Labor Statistics. The Local Area Unemployment Statistics (LAUS) program tabulates employment and unemployment estimates of persons by county of residence (see Wyoming County Unemployment Rates in each issue of Wyoming Labor Force Trends, http://doe.state.wy.us/LMI/trends.htm) while the Current Employment Statistics (CES) estimates (see Wyoming Nonagricultural Wage and Salary Employment in each issue of Wyoming Labor Force Trends, http://doe.state.wy.us/LMI/trends.htm) and the Quarterly Census of Employment and Wages (QCEW) counts employment by counting jobs by county of employment, instead of people (Azar, 2008). Increases in intercounty commuting in Wyoming dramatically change the relationship between county of employment (where wages are earned) and county of residence (where much of the payroll is spent). For example, a worker who lives in Converse County and commutes to Campbell County to work would be counted by LAUS in the county of residence (Converse) and by CES and QCEW in the county of employment (Campbell).
Data by county of residence include only those people who reside in that county. They can work anywhere including in that county. Data by county of employment include only those people who work in that county. They can live anywhere including in that county. With commuting changing the geographic boundaries of substate local labor markets, it was decided to produce tabulations identifying the scope of the change and the demographics of the workers involved.
Another way to tabulate employment is to use Unemployment Insurance (UI) Wage Records. Because individual records can be tied to the worker's driver's license, it is possible to ascertain both the county of employment and the place of employment for most individuals who work in Wyoming (Leonard, 2007). Using the commuting methodology (http://doe.state.wy.us/LMI/commuter_flow_2007.pdf), we were able to produce tables with employment and wages by age and gender for each county. Each county has two sets of information. The first contains tabulations based on county of residence, which corresponds to the home address on the individual's driver's license. The individual may or may not work in the county in which he or she resides. These data are similar to LAUS estimates. The second set of data contains information based on county of employment, which refers to the county in which the worker's employer is located. In the case of the employer having several units, county of employment reflects the closest location to the address listed on the employee's driver's license. The individual may or may not live in the county in which he or she works. This method is more similar to the CES estimates or QCEW tabulations. The tables are not mutually exclusive because some individuals may both live and work in the same county.
Tables are provided for 2000 and 2006. (Interim years can be produced upon request.)
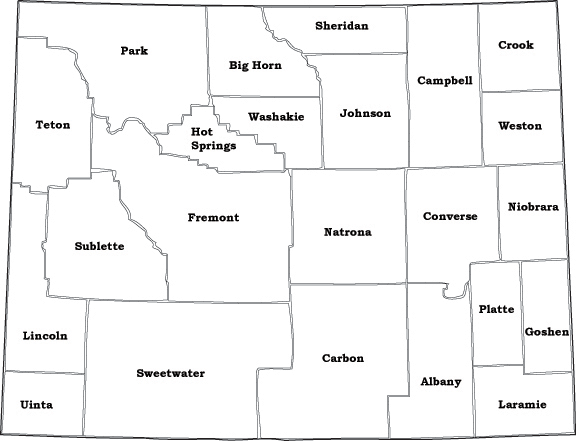
Example FindingsAs shown in the county of residence tables for Albany County (http://doe.state.wy.us/LMI/earnings/albany.htm), in 2000 there were 627 women age 55-64 (9.1% of total women) who lived in the county and worked somewhere in Wyoming, including Albany County. Those women earned an average of $22,563 during the year. In 2006, there were 922 (13.7% of total women) who lived in the county and worked in the state. They earned an average of $30,673 during the year. The number of women in the age group increased by 47.0% while the wages increased by 35.9%. Earnings represent gross compensation in all jobs worked.
Alternatively, as can be seen in the county of employment tables, there were 2,113 (11.9% of total employment) individuals working in Albany County in 2000 for whom demographics were "unknown." Individuals with unknown demographics were most likely nonresidents, even though they were not processed through the program that would define them as such (Jones, 2006). They averaged $3,156 in total annual wages. In 2006, the number of individuals with unknown demographics, whom we will refer to as nonresidents, reached 3,267 (18.0% of total employment) with an average of $6,496 in total wages. This represented a 67.4% change in the number of nonresidents and a 105.8% change in average annual earnings.
Other illustrative findings from the data sets include:
County of ResidenceAzar, R. (2008). A closer look at LAUS. Wyoming Labor Force Trends, 45(2). Retrieved May 29, 2008, from http://doe.state.wy.us/LMI/0208/a2.htm
Jones, S.D. (2006). States of origin for Wyoming workers. Wyoming Labor Force Trends, 43(4). Retrieved June 6, 2008, from http://doe.state.wy.us/LMI/0406/a1.htm
Leonard, D. (2007). Commuting pattern data model methodology and county-level output tables. Retrieved May 29, 2008, from http://doe.state.wy.us/LMI/commuter_flow_2007.pdf
|
|
|