Recent Developments in Wyoming New Business Formation
New business formation in Wyoming has been in decline for seven quarters, the longest period in the 16 years comparable data have been collected. From 2007 to 2009, only health care & social assistance continued an increase in the number of new firms. In 2009, this industry also became the third largest creator of jobs associated with new businesses and added the largest share of related wages among all industries.
N
ew business formation represents new sources of jobs, wages, and tax revenues for the state and local communities. This research examines new businesses that opened and the jobs they created in Wyoming during the recession years 2008 and 2009, as well as the relationship between new business formation and the national and state business cycle. It also reviews the industries and locations of the new firms, and compares business survival rates by industry and location.
For purposes of this research, a new business is defined as a business that did not exist previously but now hires employees, and pays wages. New branches of existing firms or the reopening of firms after temporary closures are not considered new firms.
New Business Formation History and Business Cycle
With quarterly historical data available from the Department of 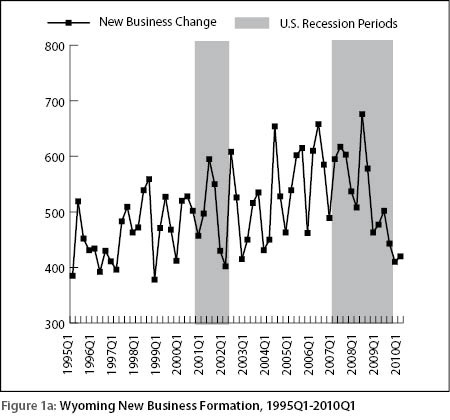 Employment's Unemployment Insurance Tax Division, it is possible to examine the relationship between new business formation and the business cycle. In general, new business formation has a seasonal pattern with a larger number of new firms opening in the second and third quarter each year and smaller numbers in the first and fourth quarter (see Figure 1a). Over-the-year changes of new firm formation vary from quarter to quarter, with no obvious pattern (see Figure 1b). From 1995Q1 to
 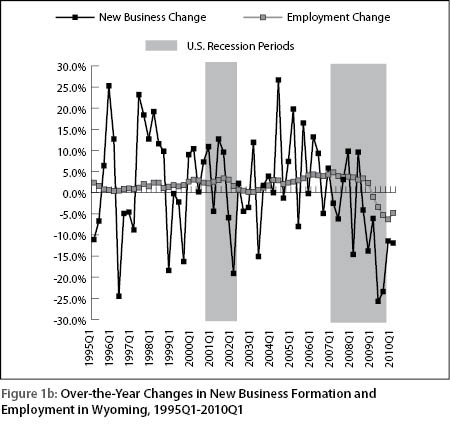 2010Q1, there were two national recessions: 2001Q1 to 2001Q4 and 2007Q4 to 2009Q2 (National Bureau of Economic Research, 2010). Wyoming's economy lagged the national downturn in both of these recession periods. For the first recession, Wyoming's economy started to experience a downturn after the nation's recession was already over. The state average employment saw near-zero rates of growth (between 0.2% and 0.7%) in 2002Q2 and the following five quarters (see Figure 1b). In the most recent recession, Wyoming lagged the national trend by five quarters, with a negative growth rate on average employment starting in 2009Q1 and continuing for five quarters thus far (2010Q1, the most recent available data). New business formation was in decline two quarters before the employment growth rate turned flat and declined in both of these recessions. This may indicate that business formation is more sensitive to some underlying economic factors than employment. During the first recession, over-the-year growth of new business formation started to decline in 2001Q4 (-5.9%) and continued for two quarters, then had small growth (2.2%) in 2002Q2, followed by another two-quarter decline. During the recent recession, new business formation began to decline in 2008Q3 and has continued for seven quarters, including the most recent quarter for which data are available (2010Q1).
In addition to the two national recessions, Wyoming's new business formation had two other continuous periods of decline lasting four quarters: 1996Q2 to 1997Q1 and 1998Q4 to 1999Q3. During these two periods, Wyoming experienced slow employment growth of 0.7% and 1.0%, respectively (Gallagher 2006). This suggests that new business formation may be affected negatively when the state's economy slows, even if the national economy is not in recession.
Demographic Analysis of New Business Formation
To comply with confidentiality restrictions and still provide detailed demographic analysis, annual data was used in this research. The focus of this article is 2009 data; 2007 and 2008 data are included in the tables for 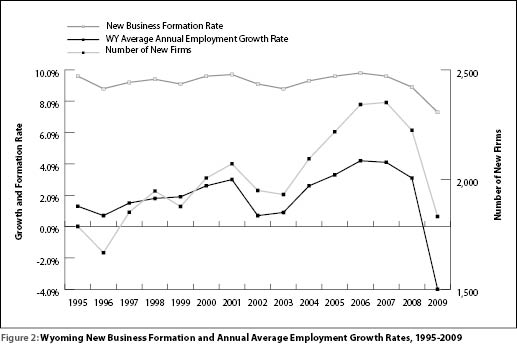 comparison purposes. New business formation in Wyoming has grown every year since 2004 and peaked in 2007 with 2,352 new firms (see Figure 2). It started to decline in 2008 with 2,225 new firms. In 2009, the number dropped to 1,832 new firms, 520 (-22.1%) firms less than the peak year of 2007. The decline is not surprising, in light of the long national economic contraction and the sharp decline in annual average employment growth in the state in 2009 (-4.0%). A total of 6,588 jobs and $126.3 million in wages were due to new business formation in 2009, and accounted for 2.4% of state average employment and 1.1% total wages.
The formation rate (number of new firms divided by total firms) remained relatively stable over the past 14 years, ranging from 8.8% to 9.8% (see Figure 2). In 2009, it dropped to 7.3%, a record low. This low rate may reflect how the most recent recession has affected new business formation. Furthermore, the housing and financial crises may have limited borrowers' ability to get loans to start businesses.
Business Formation by Industry
From 2000 to 2009, some industries' formation rates fluctuated substantially from year to year, such as mining (19.2% in 2001, compared to 5.8% in 2009; see Table 1), but a majority of the industries had relatively stable formation rates over that period. In general, educational services, administrative & waste services, and construction had higher business formation rates than other industries.
For the past nine years, the southwest region of Wyoming was the fastest growing region for new firms in the state (see Figure 3). New  business formation continued to be highest in the southwest in 2009 with a total of 498 new firms added (27.2%; see Table 2). The southeast was second with 409 firms (22.3%), followed by the northeast, which gained 321 firms (17.5%). The central region expanded by 293 firms (16.0%), and the northwest by 249 (13.6%). All regions showed a significant decline in the number of new firms in 2009 compared with the previous two years. For example, the northwest region decreased 27.4% and the southwest was down 23.7% from 2007 levels. In general, initial jobs associated with new businesses were distributed similarly among regions. Of the 6,588 jobs created by new firms in 2009, 26.9% were in the southwest region; 19.2% were in the southeast; and the northeast had 17.9%. The central region was fourth in terms of the number of job gains (17.8%), but shared the second largest portion of new business-associated wages ($30.2 million, or 23.6%; see Table 3), following the southwest, which shared more than one-fourth (25.6% or $32.8 million). This suggests that the central region gained a larger proportion of high-paying jobs than other regions in 2009.
Laramie County added the most new firms (260) and associated jobs (832) of all counties in 2009. Natrona County was second, with 205 new firms and 783 related jobs. Teton County followed with 186 new firms and 565 jobs. However, Campbell County had the third highest number of associated jobs (667).
While Laramie County added more new firms and jobs than Natrona County, new firms in Natrona County contributed more new business-related wages, $22.8 million (17.8%). Laramie, Teton, and Campbell counties were second, third, and fourth, respectively, generating $15.2 million, $11.6 million, and $10.8 million in wages.
All but three counties in Wyoming had much slower paces in new business formation in 2009 than in 2007. The exceptions were Weston and Washakie counties, which had increases of 15.4% and 12.0%, respectively, while Converse County remained at the same level as in 2007.
Construction has led all industries in 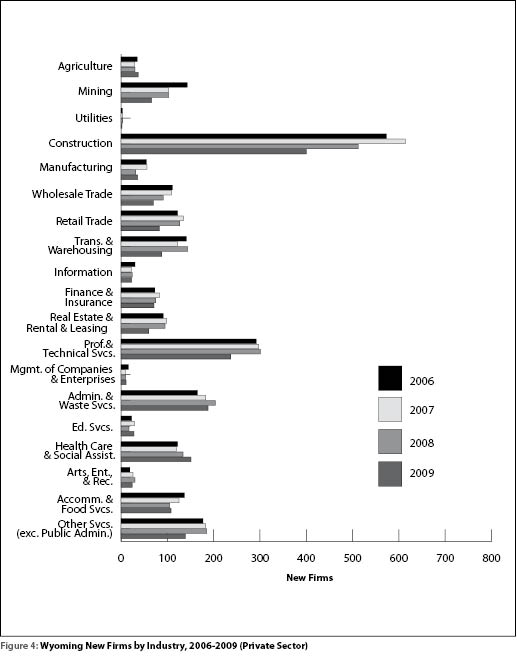 business formation for years (see Figure 4). In 2009, it again contributed the largest share of new businesses (400 new firms, or 21.0% of the state total); associated jobs (1,465 jobs, or 22.2%; see Table 4); and the second largest share in wages ($25.4 million, or 19.8%; see Table 5). However, construction business formation was much lower in 2009 than in the previous two years. Compared with the 2007 level, construction in 2009 had 214 fewer new firms (- 34.9%), 2,293 fewer associated jobs (- 61.0%), and $66.6 million less in wages (- 72.4%).
Professional & technical services had the second largest number of new firms with 237 (12.9%) in 2009, followed by administrative & waste services with 188 firms (10.3%). Accommodation & food services contributed the second largest number of jobs at 1,087 (16.5%).
Health care & social assistance was the only industry that showed continuous increases in the number of new firms from 2007 to 2009, regardless of economic expansion or contraction. In 2009, it brought in 151 new firms (32 more, or a 26.9% increase from 2007). This industry also led the state in wages related to new business in 2009, with $25.5 million (19.9% of the state total; more than triple its 2007 level, $8.4 million), and provided the third-largest number of jobs (880 or 13.4%; a 58.3% increase from 2007).
After peaking in 2006, new business formation in mining slowed in recent years. Only 66 new firms were created in 2009, a drop of 35.9% from 2007 (103 firms). The number of jobs created also dropped from 691 in 2007 to 322 in 2009 (-53.4%), while associated wages fell from $23.6 million to $11.4 million.
Table 6 shows combined data for 2008 and 2009. About half of the 4,057 new firms in 2008 and 2009 went to two regions in the state: the southwest (27.0%) and southeast (22.7%). However, the industry distribution by location was quite different. Natural resources, transportation conditions, geographic location, population, and special projects such as pipeline, wind farm construction, and highway construction are among the main factors that caused large, uneven industry distributions. Nearly one-third (32.0%) of new mining firms were located in the southwest region and another 26.6% were located in the central region. Only 4.7% of mining firms opened in the southeast region. However, the southeast region had the largest share of new firms from industries not related to natural resources & mining, such as 37.8% in educational services, 32.7% in professional & technical services, 29.8% in information, 29.5% in finance & insurance, and 28.4% in health care & social assistance. As the fastest growth region in Wyoming, the southwest gained the largest share of new firms from a wide range of industries, not just mining. For example, the southwest region accounted for two-thirds of new utilities firms, and between 30% and 40% of new firms in real estate & rental & leasing, management, transportation & warehousing, and arts, entertainment, & recreation.
New Business Survival Rate
Analysis of new business formation also needs to include an examination of survival rates. Due to limited information on business transitions such as sale, merging, and dividing, we only consider firm survival relative to the original owners.
If a firm is still reporting its employment and wage information to the Department of Employment Tax Division one year after opening, it is considered to have survived one year. The one-year survival rate is the result of one year survivals divided by the total number of new firms established during that year. The same method is used to define survivals and survival rates of two, three, or more years.
Several factors could impact a firm's survivability, such as the supply and demand for a specific product or service the firm provides, competition from similar businesses, government policies, supply of required labor, and location. Information about the prospects of a business surviving in a given industry and location would help individuals who are planning to open businesses. It may also help the Wyoming Business Council and other public and private funding sources for new ventures to develop practical strategies that may ensure a greater return on investment when establishing a new firm.
Research shows that survival rates decrease as the years firms have 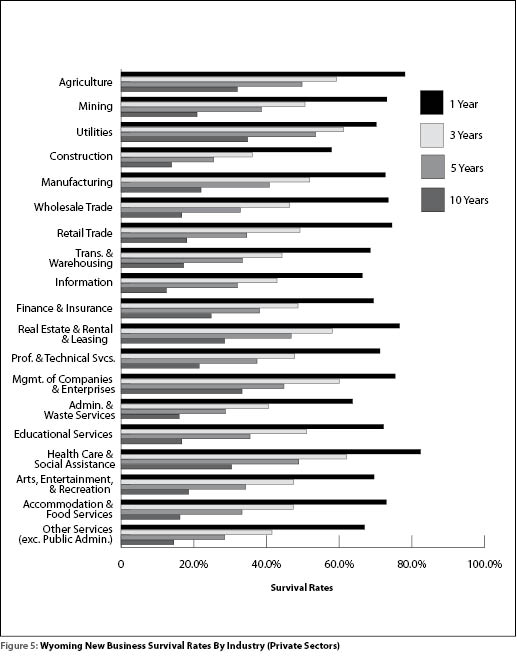 been in business increase (see Figure 5). Statewide, over two-thirds (68.8%) of new firms survived 1 year after opening and more than one-third (34.0%) were still active after 5 years. Health care & social assistance was the only industry that had more than 80% of new firms still in business 1 year after opening. Firms in agriculture had the second highest 1-year survival rate (78.1%), followed by firms in real estate & rental & leasing with 76.6%. Construction showed the worst 1-year rate, with only 57.9% firms still active. This may directly relate to the large proportion of temporary projects such as roads, oil and gas pipelines, buildings, etc. For the long term (5 years or 10 years), firms in utilities had the highest survival rates, with over half (53.5%) surviving 5 years and over one-third (34.8%) still active after 10 years in business.
Even in the same industry, a firm's likelihood of survival could vary largely by location. For example, 100% of firms in utilities survived one year in business in the northwest region, but only half survived one year in the central region (see Table 7). On the other hand, firms in agriculture in the central region showed a higher one-year survival rate (87.7%) than in all other regions. Some industries had very similar one-year survival rates in all five regions of the state; health care & social assistance had rates across all regions that ranged from 82.1% to 83.2%.
Would firms that opened during the most recent recession be less likely to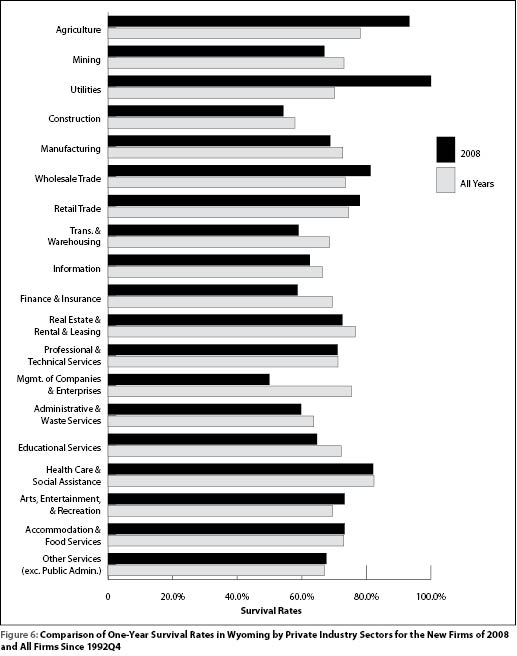 survive because they faced a tough market for their products and services when they started? To answer this question, this research used new firms in 2008 as a cohort. These firms opened at the start of the national recession and went through part of Wyoming's economic downturn in 2009. More than half of the new firms in private industry sectors in 2008 had lower one-year survival rates than all firms since 1992Q4 (see Figure 6).
Firms in management had the largest difference, with only 50% of new firms in 2008 still active one year after, compared with the overall firms rate of 75.4%. There were no significant rate decreases in professional & technical services (71.1% compared to 71.2%) and health care & social assistance (82.1% compared to 82.4%). Surprisingly, seven other industry sectors showed higher one-year survival rates for 2008 than for firms overall. For example, all firms in utilities, 93.3% of firms in agriculture, and 81.3% of firms in wholesale were still active one year after their openings in 2008, compared with the overall rates of 70.2%, 78.1%, and 73.5%, respectively. This may suggest that some of the new firms were well prepared before entering this tough market. They may have developed or adopted new technologies to reduce costs or applied more efficient ways to operate their businesses.
Summary
This study shows that new business formation appeared more sensitive to some underlying economic factors than employment growth in Wyoming during the national recession periods. The current seven-quarters period of contraction in business formation is unlike any other period since new business formation data have been collected.
New business formation had been in decline since the third quarter 2008 and reached the third-lowest annual level in 2009 with 1,832 new firms. New firms boost the economy by creating jobs and wages, and may replace older, less efficient firms.
Regardless of economic conditions, health care & social assistance was the only industry that increased the number of new firms in the past three years. The southwest region remained the fastest growing in the state in 2009 with the largest share of new businesses, related jobs and wages.
References
National Bureau of Economic Research, 2010. Retrieved October 18, 2010, from http://www.nber.org/cycles/sept2010.html
Gallagher, Tom (2006, May). Current and Projected Demographics of the Labor Pool. Outlook 2010 Revisited: Wyoming's Labor Market at Mid-Decade, Occasional Paper No.4.