The Survey of Occupational Injuries and Illnesses for 2008
This article summarizes the 2008 Wyoming Survey of Occupational Injuries and Illnesses results and compares them to previous years. The data include estimates of incidence rates by industry and the nature, part of body, source, and event or exposure that caused the injury or illness. Also included are worker demographics, such as age and gender. State and local government data are discussed briefly. An estimated 3,210 occupational injuries and illnesses occurred in private industry in Wyoming in 2008, a 6.2% decrease from 3,420 in 2007. The number of serious injury or illness cases has remained at 3,800 or below for the past six years.
Research & Planning (R&P) annually conducts the Survey of Occupational Injuries and Illnesses (SOII) for Wyoming in cooperation with the U.S. Bureau of Labor Statistics (BLS). The survey data identify the estimated incidence rates (see Definitions) of injuries and illnesses at the industry level. Detailed characteristics of severe injuries and illnesses (those that result in days away from work) also are identified by the survey. This information can be used by employers and safety awareness groups to focus on prevention. The data are also used by regulatory agencies for tracking injury and illness trends to target safety resources.
Definitions
Closure: The date at which the VR program closed a participant’s file. This can happen for many reasons.
Case of job transfer: An injured or ill employee was assigned to a job other than his or her regular job for part of the day other than the day of injury or illness.
Case of restricted duty: An employee was kept from performing one or more routine functions (work activities the employee performed at least once per week) of his or her job, or was kept from working a full workday, or a licensed health care professional recommended either of the above.
Cases with days away from work: Severe cases that counted the day after the injury or onset of the illness, which may or may not include days of job transfer or restriction. Up to 180 days away from work (and/or days of job transfer or restriction) are counted for each injury.
Event or exposure: The manner in which the injury or illness was produced or inflicted, such as falls, overexertion, or repetitive motion.
Incidence rate: Represents the number of injuries and illnesses per 100 full-time workers, calculated as (N/EH) x 200,000 where:
• N = number of injuries and illnesses
• EH = total hours worked by all employees during the calendar year
• 200,000 = base for 100 equivalent full-time workers (working 40 hours per week, 50 weeks per year).
Nature of injury or illness: The physical characteristics of the disabling injury or illness, such as cuts, fractures, or sprains.
Other recordable cases: Cases not involving days away from work or days of job transfer or restricted duty but requiring medical treatment beyond first aid. Other recordable cases include, for example, stitches, prescription medication, a concussion, loss of consciousness, medical removal from job site, musculoskeletal disorders, or other significant diagnosed injury or illness.
Out of scope: An employer who did not have employees for the survey year or an employer whose employment size class or industry code changed.
Part of body: The part of the body directly linked to the nature of injury or illness cited, such as back, finger, or eye.
Relative Standard Error (RSE): A percentage of the estimate. The standard error defines a range (confidence interval) around the estimate. The approximate 95% confidence interval is the estimate plus or minus twice the standard error.
Source of injury or illness: The object, substance, exposure, or bodily motion that directly caused the disabling condition, such as chemical, vehicle, or machinery.
Background
For this survey, approximately 2,450 Wyoming private and 300 public sector (state and local government) employers were notified in December 2007 to keep records of their firms' work-related injuries and illnesses during calendar year (CY) 2008 using the Occupational Safety & Health Administration (OSHA) 300 form. Along with data from the original firms sampled, occupational injury and illness data for approximately 200 employers (from the mining, except oil and gas, and railroad industries) were added by two federal agencies: the U.S. Department of Labor, Mine Safety & Health Administration (MSHA) and the U.S. Department of Transportation, Federal Railroad Administration (FRA) at the direction of the BLS. In January 2009, both public and private employers were sent a pamphlet describing how to transfer data from the OSHA 300 form to questionnaires available by the Internet or e-mail, the first year in which BLS attempted to collect the majority of data using electronic methods.
Employers were asked to respond within 30 days. Two subsequent mailings were sent to increase response rates, after which employers were contacted by phone to acquire the information. Employers were also contacted to verify and/or correct data. All told the data collection period lasted approximately seven months. After the data collection period, data and results were reviewed by regional and national BLS staff and incidence rates calculated.
Approximately 12% of both the private and public sector employers in the original sample were determined to be out of scope, had gone out of business since the sample was drawn, had a duplicate record, could not be mailed a questionnaire, or otherwise did not meet the criteria for inclusion. Of the remaining employers in the original sample as well as the mining, except oil and gas, and the railroad employers, 94% provided useable responses for the survey.
Several data collection problems occurred with CY 2008 SOII data. One problem was that some smaller Wyoming employers did not have access to the Internet or e-mail. Firms that lacked Internet or e-mail access contacted R&P to be sent a 12-page booklet to enable them to provide the information. A second and related problem was that some employers who had Internet or e-mail access had trouble using the BLS website and/or the Adobe electronic form (employers were sent the Adobe form by e-mail upon request). The national office would then track down what was wrong and correct it. Despite these challenges, Wyoming achieved a 94% response rate. Some of these problems experienced with collecting CY 2008 data were dealt with prior to data collection for CY 2009, and the electronic response rates are expected to increase.
Methodology
Data were reported by employers on the basis of unique incidents and employees. If an employee experienced more than one work-related injury or illness during the calendar year, each incident was reported separately and is called a case. If an incident injured more than one employee, each employee was reported on the questionnaire. To be categorized as a recordable case, an injury or illness must have required medical treatment beyond first aid (for additional information see the OSHA Recordkeeping Handbook online at http://www.osha.gov/
recordkeeping/handbook
/index.html#1904.5).
The BLS estimates incidence rates from the gathered data. Incidence rates by industry indicate the number of illnesses or injuries per 100 employees. National rates are determined from standard surveys conducted throughout the country. The incidents deemed the most serious are those which involve days away from work. The BLS counts up to a cap of 180 days away from work per case, even though there are cases with more than that. Cases associated with employees who do not require time off from work beyond the day of injury are not included. Cases with days of restricted duty or job transfer are counted in the summary of injuries and/or illnesses. Also, other recordable cases, those requiring medical treatment beyond first aid, are also counted in the summary. These latter two categories are not detailed in the case and demographics, just the cases with days away from work.
 Incidence Rates

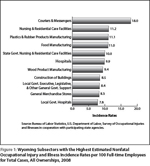
In 2008 the total (including all ownerships) estimated incidence rate in Wyoming for all ownerships was 4.8 injuries and illnesses per 100 full-time employees. The private sector estimated incidence rate was 4.6. The rate for state and local government was 5.4. For state government alone, the rate was 3.7; for local government alone, the rate was 6.2.Four of the 10 subsectors with the highest estimated incidence rates nationally were also found in Wyoming's top 10 (See Figures 1 and 2). The  relative standard error published by BLS was used to calculate the estimates, with a 95% confidence interval. The tables with the relative standard errors are available upon request.
Case and Demographic Data
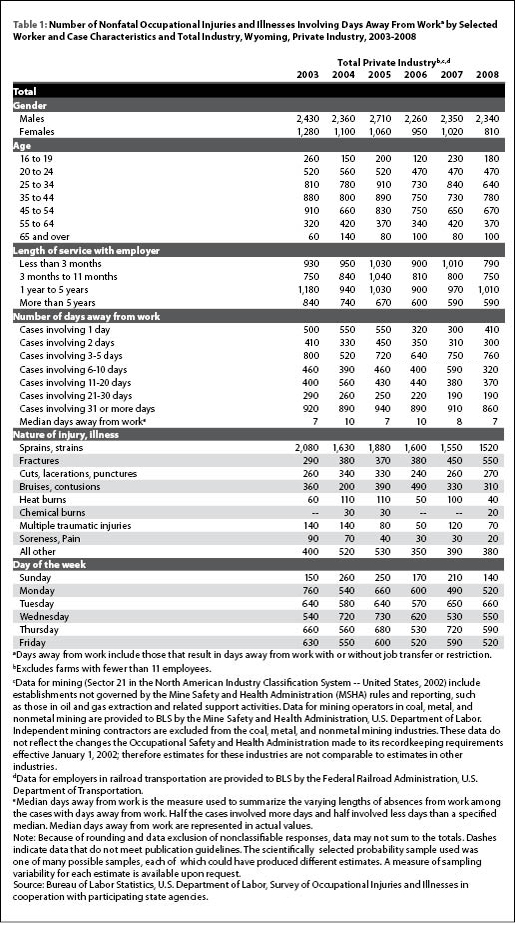
Table 1 shows the number of nonfatal occupational injuries and illnesses by selected characteristics for Wyoming from 2003 to 2008. These data show only cases with days away from work; they do not include cases that resulted solely in job transfer or restricted duty or those that were other recordable cases.
Worker Characteristics
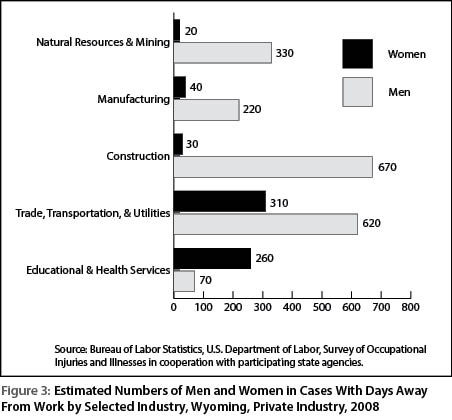
In 2008, 76.7% of Wyoming's total male population was in the state's workforce (BLS, 2009). Of the total work-related injuries and illnesses in 2008, 72.9% involved men. This contrasts with the Census of Fatal Occupational Injuries & Illnesses (CFOI) data showing that 96.9% of Wyoming fatalities in 2008 were men (CFOI, 2009). The percentage of the population of women in Wyoming who were working was 62.0% in 2008 (BLS, 2009), but only 25.2% of workers who became injured or ill in 2008 were women. In the natural resources & mining industry, 330 men and 20 women were injured or became ill on the job (see Figure 3). Trade, transportation, & utilities had twice the number of men (620) than women (310) who suffered cases with days away from work. More women than men were hurt or became ill in the educational & health services industry (260 and 70, respectively).
The major occupational groups construction & extraction and 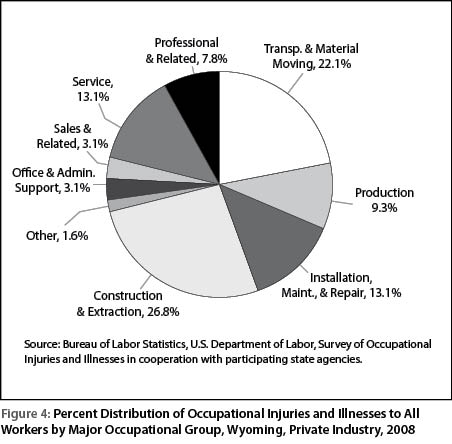 transportation & material moving had higher-than-average injury and illness rates (see Figure 4). Far more men than women worked in these occupational groups. These workers included salespersons, truck drivers, and laborers. However, more women than men were injured in service occupations such as
 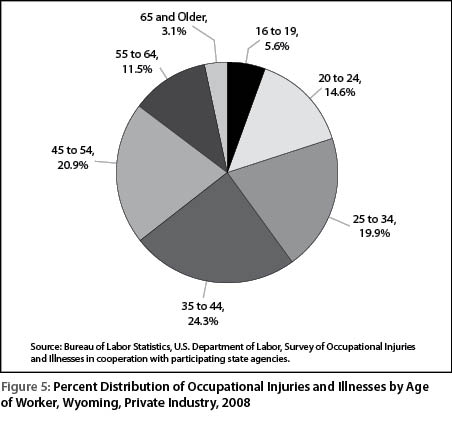 nursing aides and maids & housekeeping cleaners; more women than men were employed in these occupations.
The highest percentage of injuries and illnesses by age group in 2008 was for workers age 35 to 44 (24.3%; see Figure 5). In contrast, the age group with the most injuries and illnesses in 2007 was age 25 to 34 at 24.6%.
Injury and Illness Characteristics
For injuries resulting in days away from work, the largest percentage 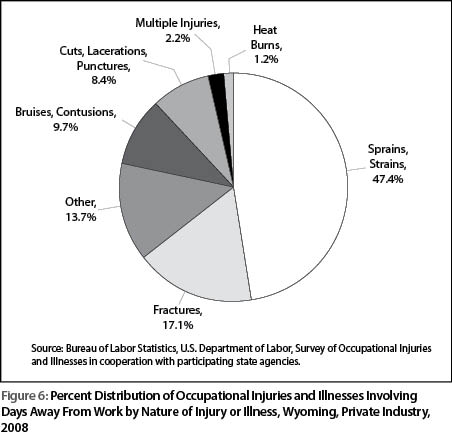 for nature of injury or illness was due to sprains and strains (47.4% in 2008; see Figure 6). Often the injuries were caused by falling, lifting, twisting and bending, standing or sitting, throwing, or reaching. In fact, sprains and strains were the leading cause of injuries resulting in days away from work from 2002 through 2008. This suggests that employers should place additional emphasis on sprain and strain prevention.
Occupation
Table 2 shows five out of nine selected occupations that had high 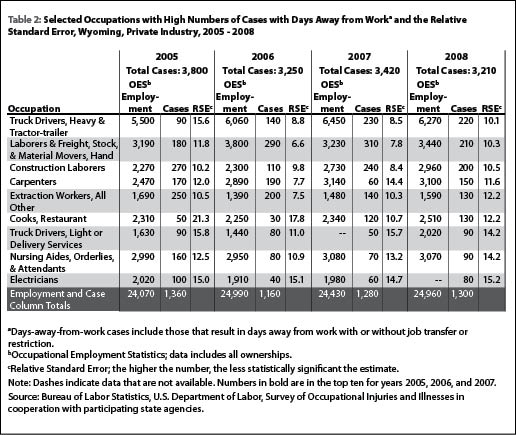 numbers of cases from 2005 through 2008. Over-the-year increases occurred in several occupations, including carpenters (60 to 150) and truck drivers, light and delivery services (50 to 90). Decreases occurred as well, with laborers & freight, stock & material movers, hand from 310 to 210 and with construction laborers (240 to 200).
In 2008, truck drivers, heavy & tractor trailer had the most injuries and illnesses resulting in days away from work (220). This occupation also had a high number of cases in 2007 (230). The second highest number of cases by occupation in 2008 was for laborers & freight, stock, & material movers, hand (210), whereas this occupation had the most cases in 2007 (310).
Much of the annual variation in the number of work-related injuries and illnesses could be related to the nature of Wyoming's jobs. Another factor could be an increase or decrease in employment for certain occupations. For example, in 2007 there were an estimated 3,230 laborers & freight, stock, & material movers, hand in Wyoming, (Wyoming Occupational Employment and Wages, 2008). In 2008, that number increased to 3,440 workers (6.5%; Wyoming Occupational Employment and Wages, 2009). The percentage of these employees who were injured in 2008 was 6.1%; 9.6% were injured in 2007.
Summary
From 2007 to 2008, Wyoming experienced an estimated decrease of 210 work-related injuries and illnesses resulting in days away from work for private industry. Overall, men continued to experience work-related injuries and illnesses more frequently than women. This was likely due, in part, to higher ratios of men to women employed in industries with higher incidence rates; the exception was educational & health services. In general, older workers in more dangerous professions who had less job experience incurred more work-related injuries and illnesses in 2008; the same was also generally true of prior years. More detail on 2008 data, as well as historical data and documentation is available at http://doe.state.wy.us/LMI/OSH/toc.htm.
For more information, contact Valerie A. Davis at (307) 473-3838 or vdavi@state.wy.us.
References
Bureau of Labor Statistics, Division of Local Area Unemployment Statistics. (2009, March). Employment status of the civilian noninstitutional population by sex, race, Hispanic or Latino ethnicity, and detailed age, 2008 annual averages. (Preliminary 2008 data on employment status by state and demographic group). Retrieved December 17, 2009, from http://www.bls.gov/lau/ptable14full2008.pdf
Census of Fatal Occupational Injuries and Illnesses, Wyoming. (2008). Retrieved November 19, 2009 from http://doe.state.wy.us/LMI/CFOI/CFOI_08/toc.htm
Wyoming Occupational Employment & Wages. (2009, September). Retrieved November 19, 2009 from http://doe.state.wy.us/lmi/EDSPub200909/TOC000.HTM
Wyoming Occupational Employment & Wages. (2008, December). Retrieved November 19, 2009, from http://doe.state.wy.us/LMI/EDSPub20083ECI/TOC000.HTM