Payroll Growth in Wyoming Slows from 2007Q4 to 2008Q4
Although total payroll and employment in unemployment insurance-covered jobs increased from fourth quarter 2007 to fourth quarter 2008, the growth was lower than the five-year averages. Campbell County added the most jobs, with large gains in construction, while mining (including oil & gas) added the most jobs of any sector statewide.
From fourth quarter 2007 to fourth quarter 2008, total unemployment insurance (UI) covered payroll increased by $198.6 million (6.7%). This increase was noticeably lower than the five-year average of 10.3% (see Table 1). UI covered payroll represents approximately 92% of all wage and salary disbursements and 45% of personal income in the state (U.S. Bureau of Economic Analysis, 2007). On an over-the-year basis, employment grew by 6,467 jobs (2.3%) and average weekly wage rose by $35 (4.3%). These increases were also lower than their five-year averages of 3.4% and 6.7%, respectively. Covered employment and wage data are organized by the North American Industry Classification System (NAICS; U.S. Census Bureau, 2007). NAICS is a system of classifying firms based on their production processes. Firms are then grouped into common categories known as sectors. Total payroll is an important economic indicator because it is often associated with consumption, retail sales, and sales tax revenue in Wyoming (Black & Evans, 1997).
The covered payroll and employment data in this article are measured by place of work, as compared to the labor force estimates, which are a measure of employed and unemployed persons by place of residence. Also, the employment data presented in this article represent a count of jobs, not persons. When individuals work more than one job, each is counted separately.
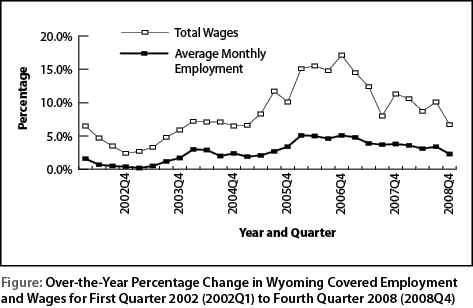
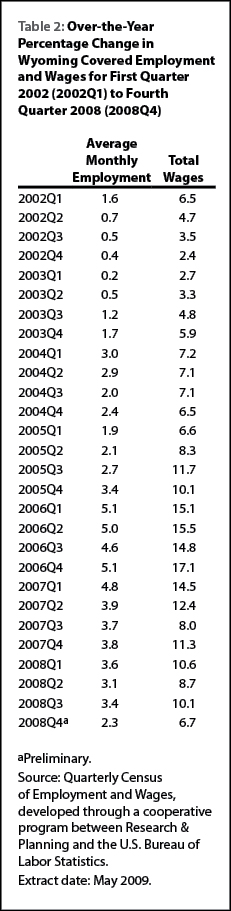
The Figure shows that total payroll growth peaked at 17.1% in fourth quarter 2006, and has been generally decreasing since that time. In fourth quarter, total payroll growth was 6.7%, its lowest level since 2005. Employment growth, which stood at 5.1% in fourth quarter 2006, decreased to 2.3% in fourth quarter 2008 (see Table 2).
The purpose of this article is to show employment and payroll changes between fourth quarter 2007 and fourth quarter 2008. These economic changes help gauge the overall strength of Wyoming’s economy and identify the fastest and slowest growing sectors and geographic areas.
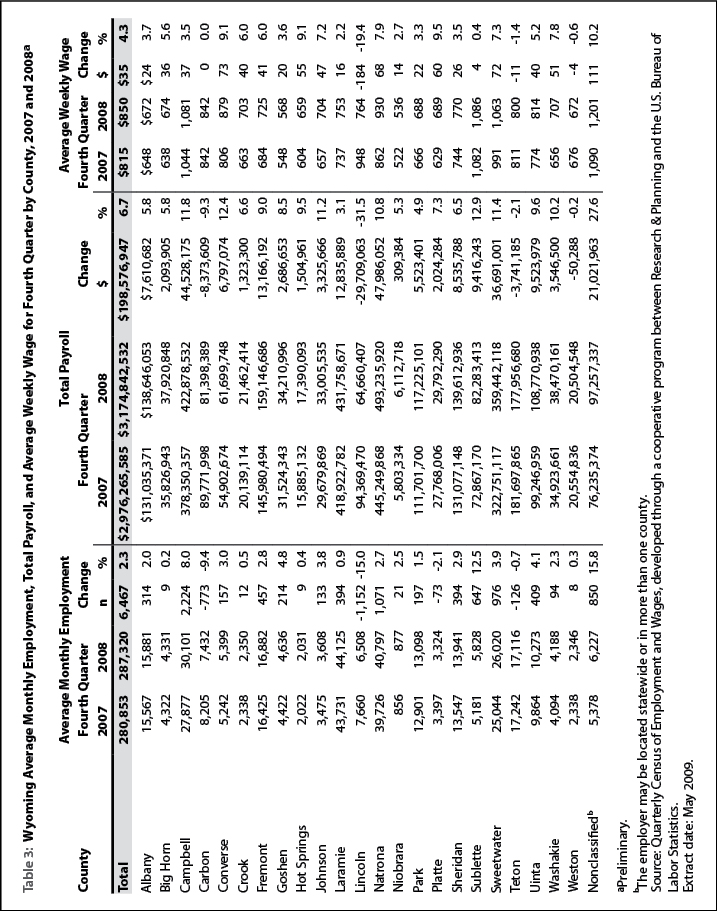
Table 3 shows that employment increased in 19 counties and decreased in 4. It seems that the largest job gains occurred in areas of the state impacted by energy development. Some of the largest job decreases at the county level appear related to the completion of large construction projects.
Campbell County added the most jobs of any county (2,224 jobs, or 8.0%) and its total payroll increased by $44.5 million, or 11.8%. Large job gains were seen in construction (more than 750 jobs) and mining (including oil & gas; more than 550 jobs). Notable growth also occurred in wholesale trade, administrative & waste services, health care & social assistance, and accommodation & food services.
Sweetwater County gained 976 jobs, or 3.9% and its total payroll grew by $36.7 million, or 11.4%. Mining (including oil & gas) added more than 700 jobs and smaller gains were seen in manufacturing, transportation & warehousing, professional & technical services, and accommodation & food services. Notable job losses occurred in construction and administrative & waste services.
Sublette County was the fastest growing county, adding 647 jobs, or 12.5% and $9.4 million, or 12.9% in total payroll. Mining, including oil & gas, added more than 400 jobs, while smaller job gains were seen in retail trade, transportation & warehousing, administrative & waste services, and local government.
Fremont County added 457 jobs or 2.8% and its total payroll grew by $13.2 million, or 9.0%. Large job gains were seen in local government (including public schools and colleges) and mining (including oil & gas). Job losses occurred in construction, manufacturing, information, and private education.
Uinta County’s total payroll rose by $9.5 million, or 9.6% and employment grew by 409 jobs, or 4.1%. The construction sector posted the largest job gains (more than 300 jobs), with more modest gains in mining, manufacturing, wholesale trade, transportation & warehousing, and health care & social assistance.
Sheridan County gained 394 jobs, or 2.9% in fourth quarter and its total payroll increased by $8.5 million, or 6.5%. The largest job gains were found in retail trade, accommodation & food services, local government, and federal government.
Carbon County lost 773 jobs, or 9.4% and its total payroll decreased by $8.4 million, or 9.3%. The largest job losses occurred in construction (approximately 800 jobs). Some of the decrease in construction may have been related to the completion of a large project.
Employment fell by 1,152 jobs, or 15.0% and total payroll decreased by $29.7 million, or 31.5% in Lincoln County. Job losses in construction (more than 1,300 jobs) were partially offset by job gains in local government (including public schools and hospitals) and mining (including oil & gas). As in Carbon County, some of the job losses in construction may have been related to the completion of a large project.
In Platte County total payroll increased ($2.0 million, or 7.3%) but employment fell slightly (-73 jobs, or -2.1%). Minor job losses were seen in a number of sectors, including mining, construction, manufacturing, wholesale trade, retail trade, and health care & social assistance.
Teton County’s employment fell by 126 jobs, or 0.7% and total payroll decreased by $3.7 million, or 2.1%. Job losses were reported in many sectors, such as retail trade; finance & insurance; management of companies & enterprises; arts, entertainment, & recreation; and other services.
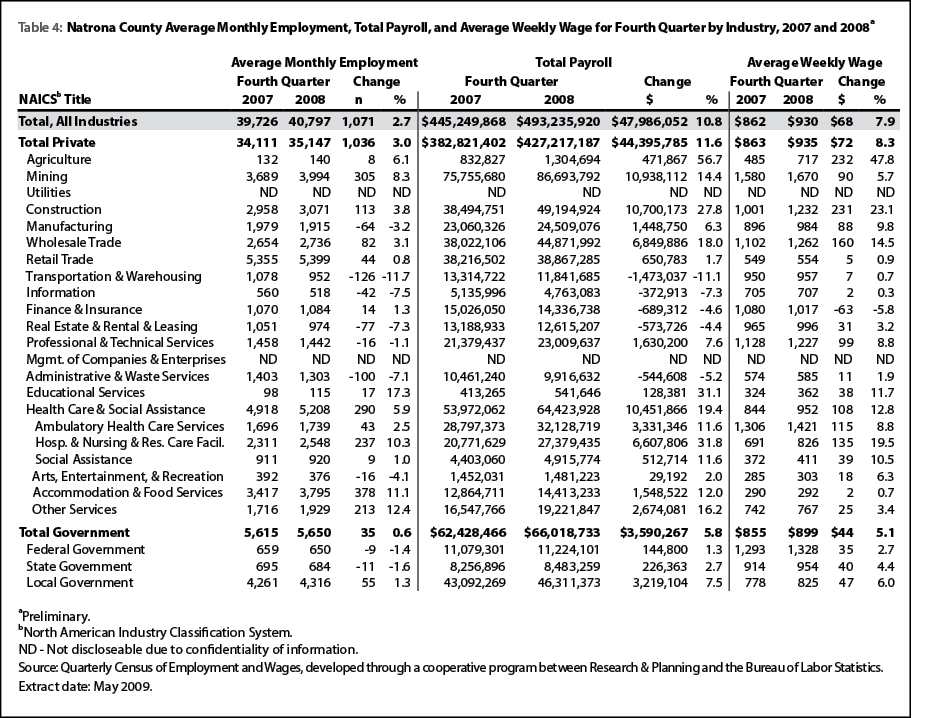
Table 4 shows that Natrona County added 1,071 jobs, or 2.7% in fourth quarter. Total payroll grew by $48.0 million, or 10.8%, the largest increase of any county. Notable job gains were seen in accommodation & food services (378 jobs, or 11.1%), mining (including oil & gas; 305 jobs, or 8.3%), health care & social assistance (290 jobs, or 5.9%), and other services (213 jobs, or 12.4%). Job losses occurred in a number of sectors, including transportation & warehousing (-126 jobs, or -11.7%), administrative & waste services (-100 jobs, or -7.1%), real estate & rental & leasing (-77 jobs, or -7.3%), and manufacturing (-64 jobs, or -3.2%).
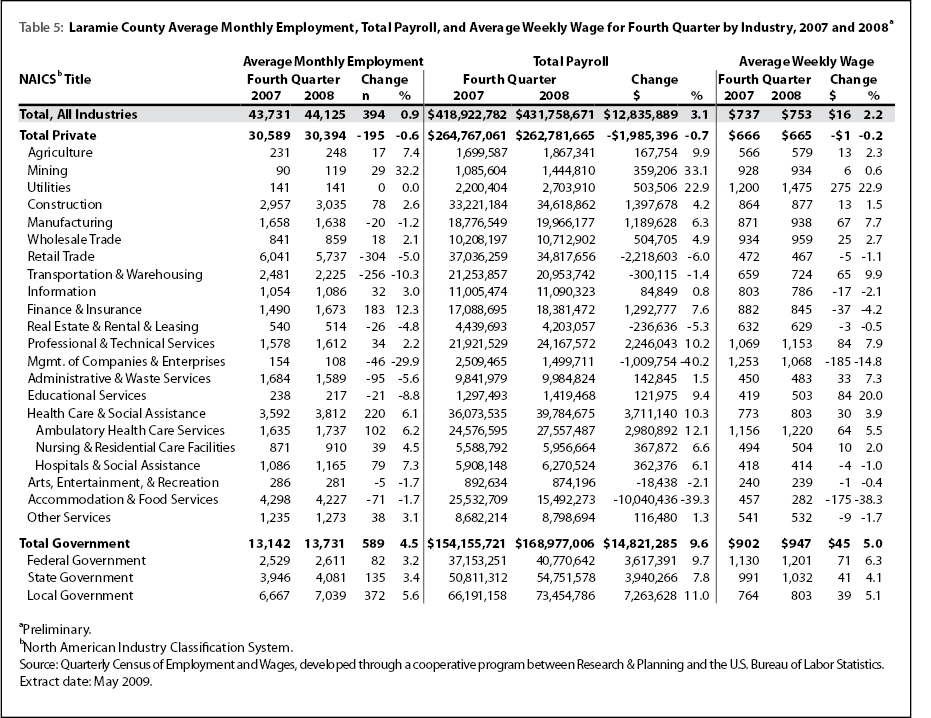
Laramie County’s total payroll increased by $12.8 million, or 3.1% and employment grew by 394 jobs, or 0.9% (see Table 5). The largest job gains occurred in local government (including public schools, colleges, and hospitals; 372 jobs, or 5.6%). Other notable job gains were seen in health care & social assistance (220 jobs, or 6.1%), finance & insurance (183 jobs, or 12.3%), and state government (135 jobs, or 3.4%). These job gains were partially offset by sizeable job losses in retail trade (-304 jobs, or -5.0%), transportation & warehousing (-256 jobs, or -10.3%), administrative & waste services (-95 jobs, or -5.6%), and accommodation & food services (-71 jobs, or -1.7%).
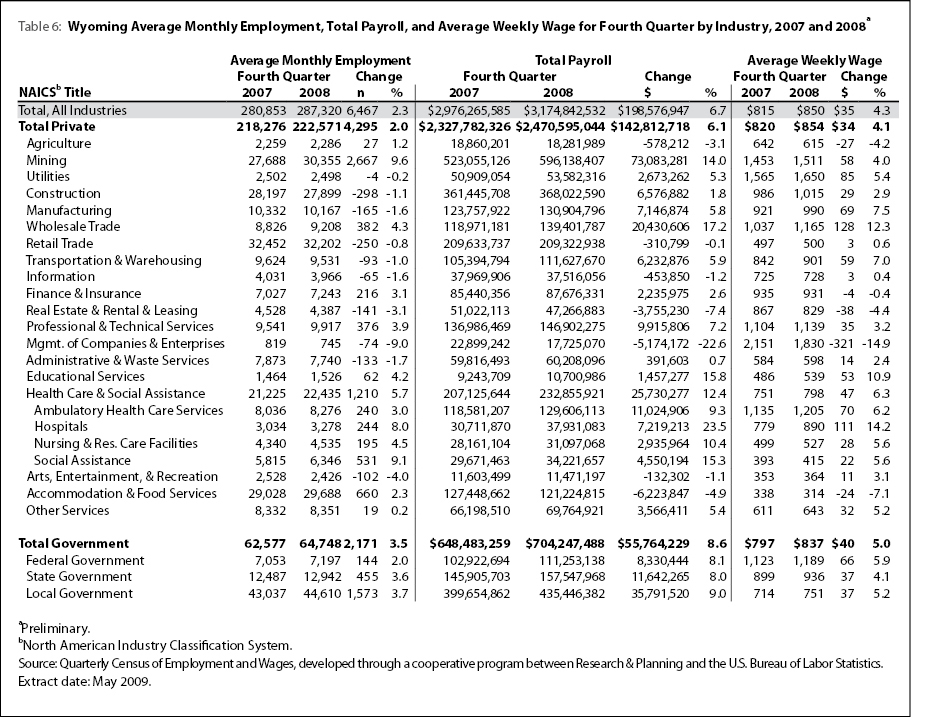
The largest increases in total payroll were found in mining (including oil & gas), local government (including public schools, colleges, & hospitals), health care & social assistance, and wholesale trade (see Table 6). The largest job growth occurred in mining, local government, health care & social assistance, and accommodation & food services.
Mining (including oil & gas) employment increased by 2,667 jobs, or 9.6% and its total payroll grew by $73.1 million, or 14.0%. Job gains were seen in oil & gas extraction (more than 300 jobs), mining, except oil & gas (approximately 550 jobs), and support activities for mining (approximately 1,800 jobs).
Total payroll in local government increased by $35.8 million, or 9.0% and employment grew by 1,573 jobs, or 3.7%. Local government educational services (including public schools & colleges) added more than 500 jobs, public hospitals added more than 350 jobs, and public administration (including cities, towns, and counties) added more than 300 jobs. Employment in arts, entertainment, & recreation (including gambling) increased by more than 200 jobs.
In fourth quarter, health care & social assistance employment grew by 1,210 jobs, or 5.7% and its total payroll increased by $25.7 million, or 12.4%. Strong growth was seen in all four subsectors. Ambulatory health care services added 240 jobs, or 3.0%, private hospitals added 244 jobs, or 8.0%, nursing & residential care facilities added 195 jobs, or 4.5%, and social assistance added 531 jobs, or 9.1%.
In fourth quarter, accommodation & food services added 660 jobs, or 2.3%, but its total payroll decreased by $6.2 million, or 4.9%. It appears that this sector may have been affected by large bonuses in fourth quarter 2007, which were not repeated in 2008. Accommodation added more than 450 jobs, while food services & drinking places added fewer than 200 jobs.
Employment decreased in 10 different sectors in fourth quarter: utilities; construction; manufacturing; retail trade; transportation & warehousing; information; real estate & rental & leasing; management of companies & enterprises; administrative & waste services; and arts, entertainment, & recreation. In comparison, employment fell in seven sectors during third quarter.
Construction employment fell by 298 jobs, or 1.1%, but its total payroll increased by $6.6 million, or 1.8%. Large job losses were seen in heavy & civil engineering construction (approximately 900 jobs), but these losses were partially offset by gains in specialty trade contractors which added approximately 600 jobs.
Manufacturing employment decreased by 165 jobs, or 1.6% and its total payroll rose by $7.1 million, or 5.8%. The largest job losses were seen in wood product manufacturing (more than 100 jobs), and smaller job losses were seen in printing & related support activities, petroleum & coal product manufacturing, plastics & rubber products manufacturing, and nonmetallic mineral product manufacturing.
Employment in retail trade fell by 250 jobs, or 0.8% and total payroll fell by $310,799, or 0.1%. Job losses in motor vehicle & parts dealers (approximately 250 jobs), health & personal care stores (approximately 100 jobs), clothing stores (approximately 100 jobs), and miscellaneous store retailers (approximately 100 jobs) were partially offset by gains in electronics & appliance stores (approximately 100 jobs), building material & garden equipment & supplies dealers (nearly 200 jobs), and general merchandise stores (more than 100 jobs).
Total payroll in transportation & warehousing rose by $6.2 million, or 5.9%, but employment fell by 93 jobs, or 1.0%. Job losses in warehousing & storage and transit & ground passenger transportation were partially offset by gains in air transportation and truck transportation.
Information employment fell by 65 jobs, or 1.6% and total payroll decreased by $453,850, or 1.2%. Job losses were seen in publishing industries (including newspapers) and motion picture & sound recording industries.
Real estate & rental & leasing lost 141 jobs, or 3.1% and its total payroll decreased by $3.8 million, or 7.4%. It appears that job losses were concentrated in machinery & equipment rental & leasing.
Employment in management of companies & enterprises decreased by 74 jobs, or 9.0% and total payroll fell by $5.2 million, or 22.6%. Most of the job losses occurred in corporate, subsidiary, & regional managing offices.
Administrative & waste services employment fell by 133 jobs, or 1.7%, but total payroll increased by $391,603, or 0.7%. The largest job losses were seen in employment services (including temporary help agencies). Employment increased in waste management & remediation services.
Arts, entertainment, & recreation lost 102 jobs, or 4.0% and its total payroll decreased by $132,302, or 1.1%. Approximately half the job losses were found in gambling industries.
In summary, growth in total payroll, jobs, and average weekly wage slowed considerably in fourth quarter and fell below their five-year averages. Job losses were more widespread than in previous quarters, occurring in ten industry sectors. Growth was seen in all but four counties of the state, with the fastest growth being reported in areas affected by energy development.
References
Black, D. & Evans, M. (1997, May). Work, pay and consumer spending, part one: Sales tax collections and total payroll. Wyoming Labor Force Trends, 34(5), Retrieved September 11, 2008, from http://doe.state.wy.us/lmi/0597/0597a2.htm
U.S. Bureau of Economic Analysis. (2007, May 15). SA04 State income and employment summary -- Wyoming. Retrieved May 15, 2007, from http://www.bea.gov/regional/spi/default.cfm
U.S. Census Bureau. (2007, August 28). 2007 NAICS codes and titles. Retrieved September 20, 2007, from http://www.census.gov/naics/2007/NAICOD07.HTM