
Evidence from the New Hires Survey: Education and Opportunity in Wyoming’s Labor Market
In 2014, Wyoming employers in the private sector and local government added an estimated 110,105 new hires, according to Research & Planning’s (R&P) administrative databases. R&P conducts the New Hires Job Skills Survey, a sample survey of new hires identified in administrative databases that makes it possible to analyze employers’ workforce needs each quarter of the calendar year. The purpose of this article is to explain how New Hires Job Skills Survey data can be used to identify trends in Wyoming’s labor market by understanding employers’ hiring practices: which types of jobs are filled, how much employers pay, benefits they offer, skills employers are seeking, and employers’ reported satisfaction with the skills of new hires.
The Research & Planning (R&P) section of the Wyoming Department of Workforce Services, through access to administrative records, publishes turnover data on a quarterly basis (see http://doe.state.wy.us/LMI/turnover.htm). 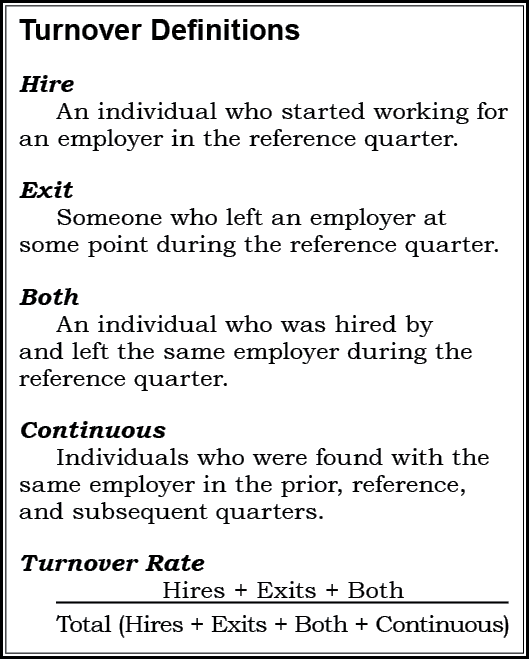 As shown in the Box, there are four components to turnover: hires, exits, both hires and exits, and continuous employment. This article focuses on a specific type of hires: new hires, which are defined as individuals who, during a particular quarter, started working for an employer he or she had not worked for since at least 1992, the first year for which R&P has wage records (Knapp, 2011).
In fourth quarter 2009 (2009Q4), R&P began administering a New Hires Job Skills Survey (New Hires Survey) in order to broaden and enhance the organization’s understanding of Wyoming’s labor market. The New Hires Survey allows R&P to collect rich survey detail not previously available, such as occupation, rate of compensation, benefits, important job skills, employer satisfaction with a new hire’s skills, retention, and more. R&P is able to link New Hires Survey data to existing administrative databases, such as Unemployment Insurance Wage Records and Wyoming Department of Transportation driver’s license files. By linking results of the New Hires Survey with several administrative databases, R&P is also able to identify new hires characteristics such as age and gender.
The New Hires Survey is sent to a random sample of hires by employers in the private sector and local government each quarter. Since the start of the survey, R&P has attained at least a 70% response rate per quarter. Based on these quarterly samples of hires, R&P estimates the characteristics of all new hires. For example, in 2014Q2, Wyoming employers made 75,662 hires. Of those, 34,138 (45.1%) were new hires, or individuals who were hired by an employer for which they had never before worked. R&P then surveyed a random sample of the employers who employed new hires. The estimates of the characteristics of new hires that are presented in this article are based on New Hires Survey data collected over a two-year period from third quarter 2012 (2012Q3) through second quarter 2014 (2014Q2). The questionnaire R&P mails to employers is available at http://doe.state.wy.us/LMI/new_hires/NH_Quest_V3.pdf. Information on the methodology used for this survey and full statistical results are available at http://doe.state.wy.us/LMI/newhires.htm.
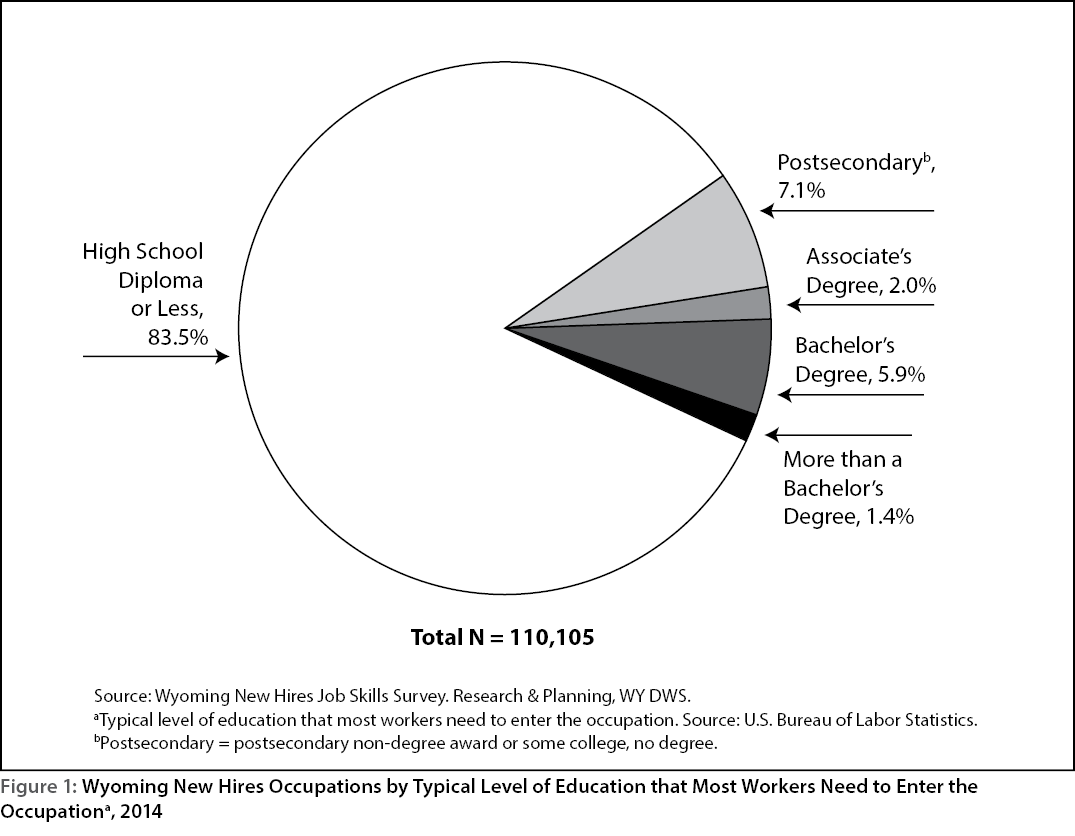
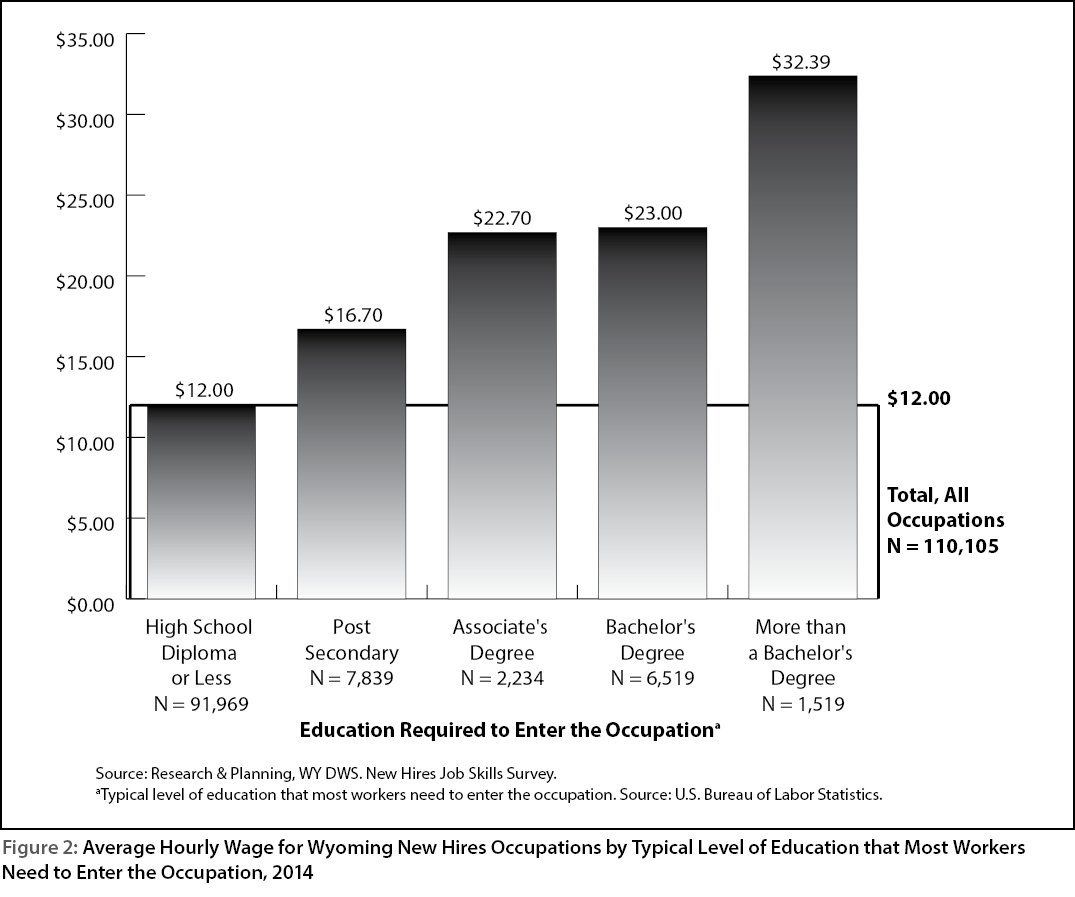
In 2014, Wyoming employers added 110,105 new hires based on unemployment insurance (UI) tax and wage administrative records. As shown in Figure 1, the majority (91,969, or 83.5%) of these new hires occurred among occupations requiring no formal education beyond a high school diploma. However, as shown in Figure 2, as educational requirements increased, so too did compensation. The average hourly wage increased with the level of education, and occupations requiring more than a high school diploma were more likely to be offered benefits such as health insurance, paid leave, and a retirement plan.
Education, Opportunity, and Wages
Table 1 shows employment and wage estimates for the five most frequently occurring occupations for each level of educational requirement, which is identified by the U.S. Bureau of Labor Statistics as the typical education required to enter a given occupation. Of the estimated 91,969 new hires in jobs requiring no more than a high school diploma (83.5% of all new hires; see Figure 1), many were hired to fill lower paying occupations such as food preparation & serving workers (5,769 new hires, $8.00 per hour), retail salespersons (4,447 new hires, $9.00 per hour), and cashiers (4,102 new hires, $8.75 per hour). The average hourly wage for new hires jobs requiring no more formal education than a high school diploma was $12.00.

In 2014, Wyoming employers added an estimated 7,839 new hires (7.1% of all new hires) to fill occupations requiring a postsecondary non-degree award or some college and no degree. The average hourly wage for these occupations was $16.70, significantly higher than the $12.00 per hour average wage for occupations requiring no more than a high school diploma. The most frequently occurring occupation in this group was truck drivers, heavy & tractor-trailer (4,482 new hires, $19.00 per hour). As shown in Table 1, many of the occupations in this group were related to health care, such as nursing assistants (703 new hires, $11.75 per hour), medical assistants (329 new hires, $10.50 per hour), and dental assistants (184 new hires, $13.00 per hour).
Occupations requiring an associate’s degree made up 2.0% (2,234) of all Wyoming new hires jobs in 2014, and many of these occupations offered substantially higher wages than those requiring a high school diploma or postsecondary education. The average hourly wage for occupations in this category was $22.70. The three most frequently occurring occupations were registered nurses (1,023 new hires, $27.21 per hour), geological & petroleum technicians (197 new hires, $22.55 per hour), and dental hygienists (172 new hires, $30.00 per hour).
Occupations requiring a bachelor’s degree accounted for 5.9% (6,519) of all new hires jobs in 2014, with an average hourly wage of $23.00. Many of the most frequently occurring occupations in this group were relatively low paying, such as substitute teachers (639 new hires, $12.38 per hour), coaches & scouts (372 new hires, $12.50 per hour), and lodging managers (296 new hires, $15.00 per hour). Higher paying jobs in this group included general & operations managers (1,168 new hires, $31.21 per hour) and elementary school teachers, except special education (191 new hires, $21.48 per hour).
Occupations requiring more than a bachelor’s degree (master’s degree or doctorate) made up just 1.4% (1,519) of all new hires jobs in 2014, with an average hourly wage of $32.39. This group included occupations such as lawyers (121 new hires, $31.25 per hour), pharmacists (111 new hires, $55.00 per hour), physical therapists (99 new hires, $42.00 per hour), and mental health counselors (98 new hires, $25.00 per hour).
The New Hires Survey also collects information on the average number of hours worked for any given occupation. The questionnaire that is sent to employers asks, “On average, how many hours were worked in this job each week during the reference period?” and then given a space to write in the number of hours. The number of hours may vary from quarter to quarter, especially with part-time or seasonal jobs. Averages for each educational requirement group are shown in Figure 3. Occupations requiring a postsecondary non-degree award or some college had the highest percentage of new hires working 36 or more hours per week on average (72.6%), while jobs requiring a high school diploma or less had the lowest (52.2%).
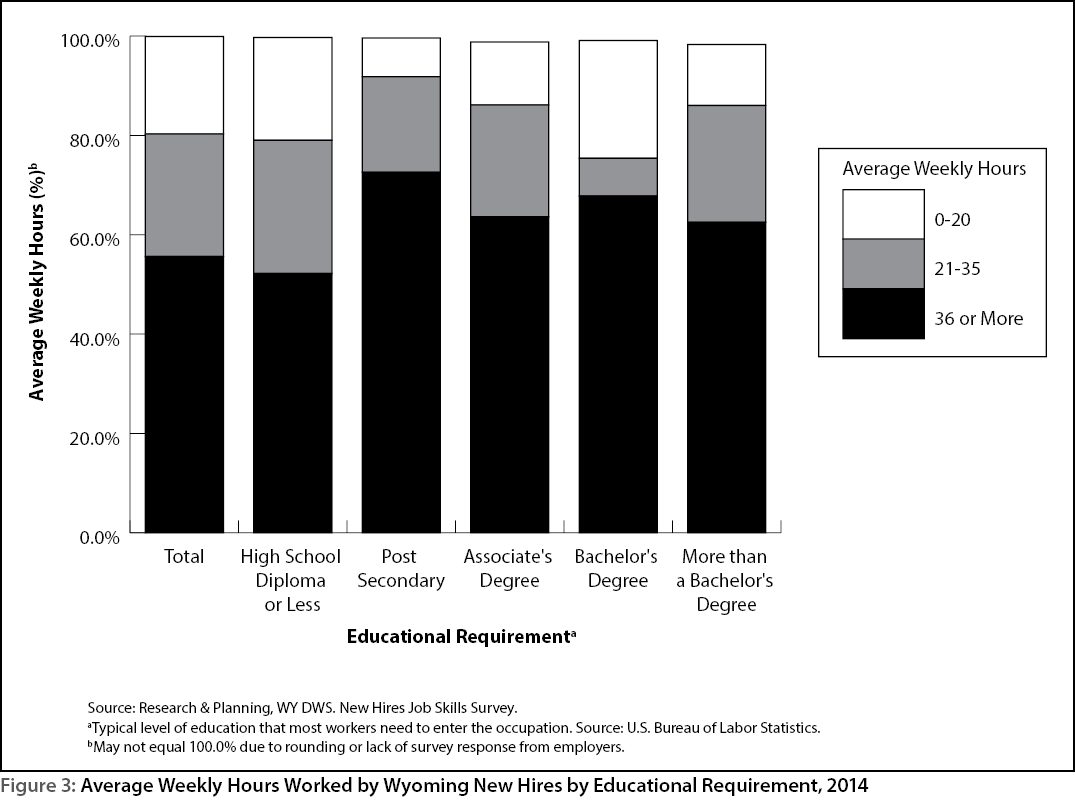
Occupations requiring a bachelor’s degree had the highest percentage of new hires working 20 hours or less (23.7%) and the lowest percentage working 21-35 hours (7.6%). As shown in Table 1, this may be due in part to the large number of new hires in education-related occupations that worked 20 hours or less per week, such as substitute teachers (639 new hires, 84.2% 20 hours or less) and coaches & scouts (372 new hires, 79.7% 20 hours or less). On the other hand, an estimated 74.5% of physical therapists worked an average of 36 hours or more per week.
Benefits
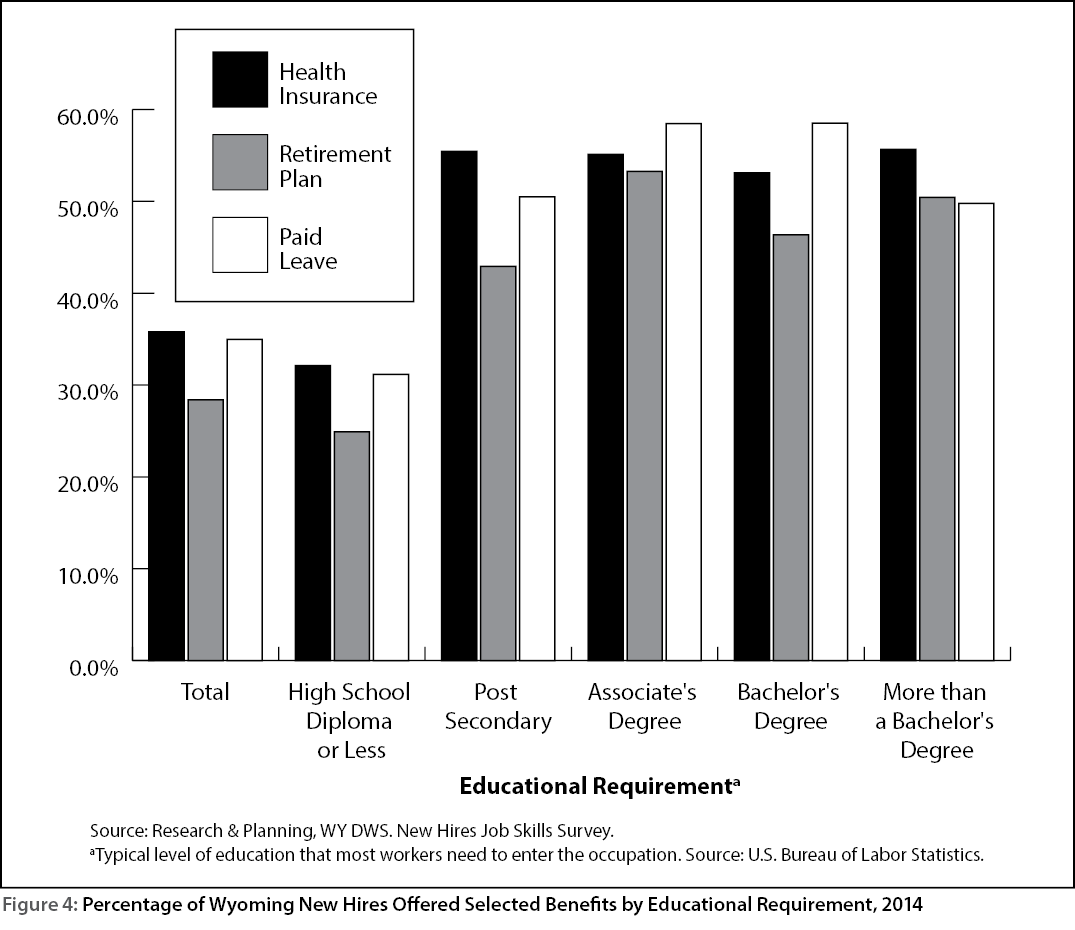
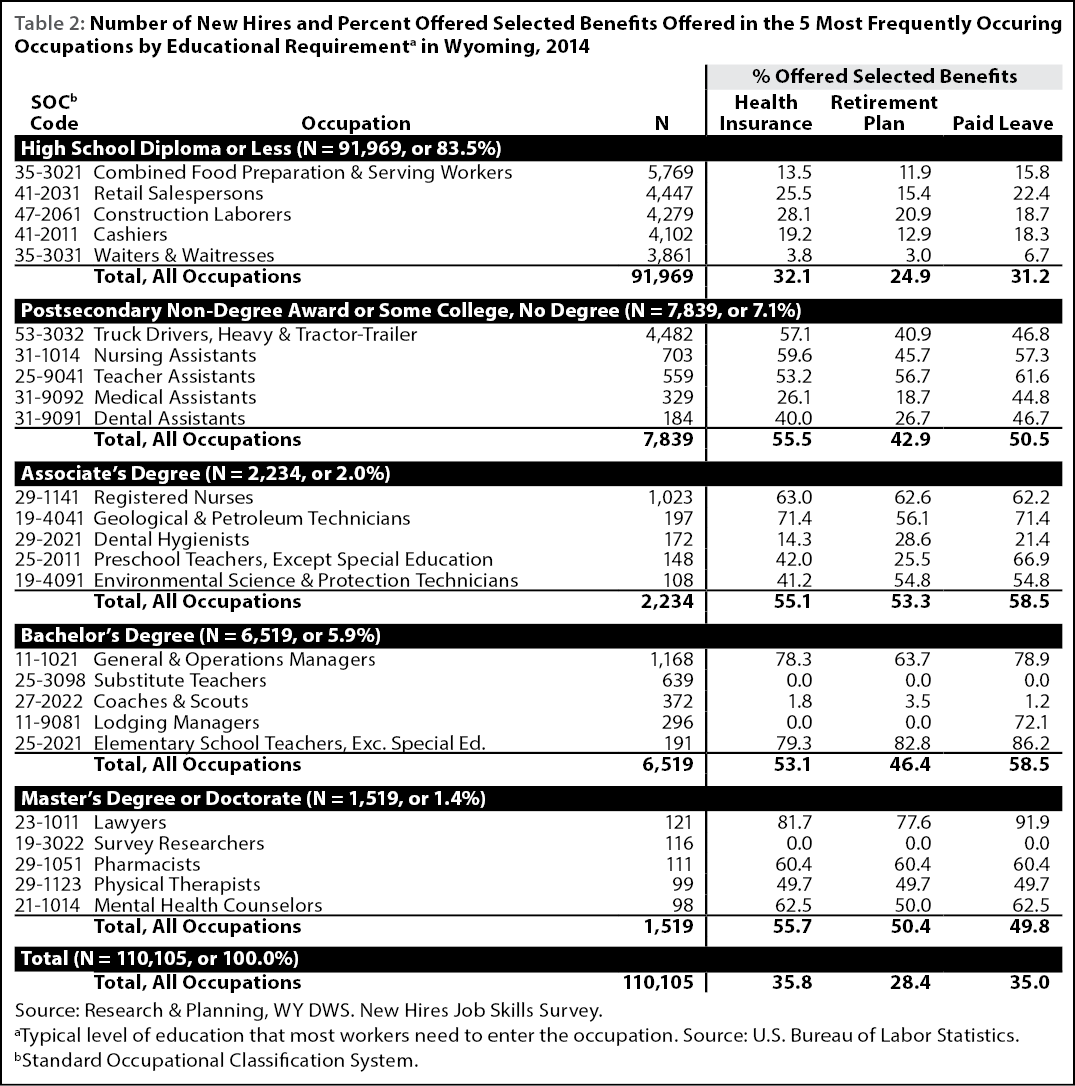
As previously mentioned, new hires in occupations requiring more than a high school diploma were more likely to be offered access to selected benefits, such as health insurance, a retirement plan, and paid leave (see Figure 4). For example, as shown in Table 2, 32.1% of all new hires jobs requiring a high school diploma or less were offered access to health insurance, compared to between 53% and 55% of new hires jobs requiring some education beyond a high school diploma. In addition, only 24.9% of new hires in occupations requiring a high school diploma or less were offered access to a retirement plan, compared to 53.3% of new hires in occupations requiring an associate’s degree. The low rate at which benefits were offered to occupations requiring a high school diploma or less may be related to the number of seasonal jobs in this category.
Job Skills

The New Hires Survey asks employers to rate the importance of five selected job skills for the occupation: service orientation, critical thinking, reading comprehension, technology design, and operation & control (see Box). Employers are asked to identify these skills as “unimportant,” “neither important nor unimportant,” or “important.” The types of job skills that Wyoming employers identified as important varied by the level of education required to enter the occupation.
For example, technology design is defined as “generating or adapting equipment and technology to serve user needs.” As shown in Figure 5, technology design was most important within occupations requiring an associate’s degree (62.1%). This is consistent with the information presented in Table 3, as many of the most frequently occurring occupations requiring an associate’s degree at the time of hire are those that may need to adapt to new and emerging technologies, specifically dental hygienists (92.9% important) and environmental science & protection technicians (81.9%).
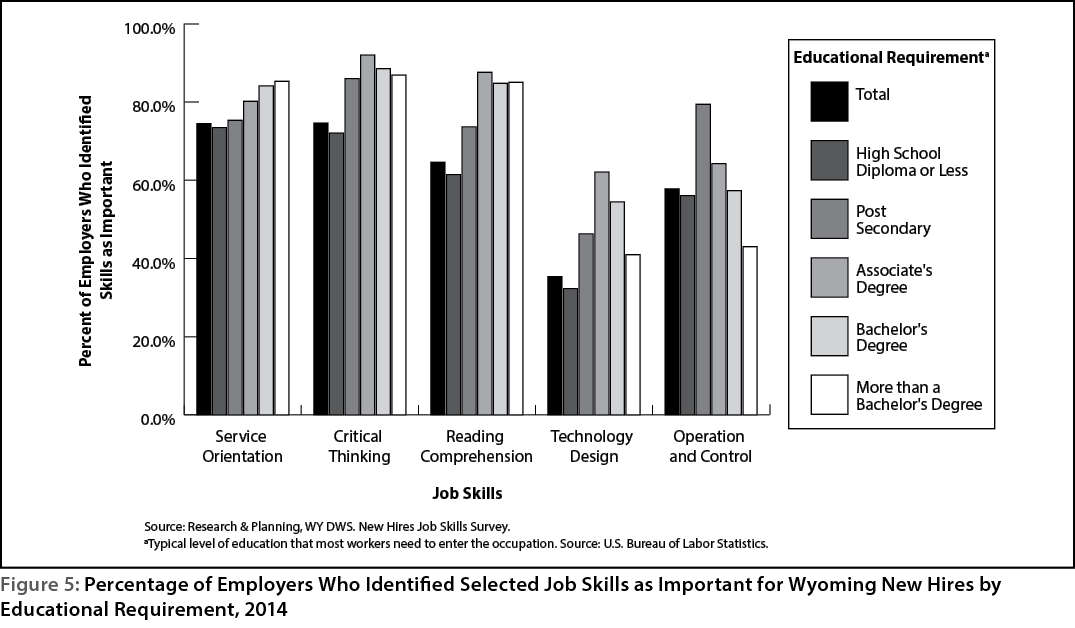
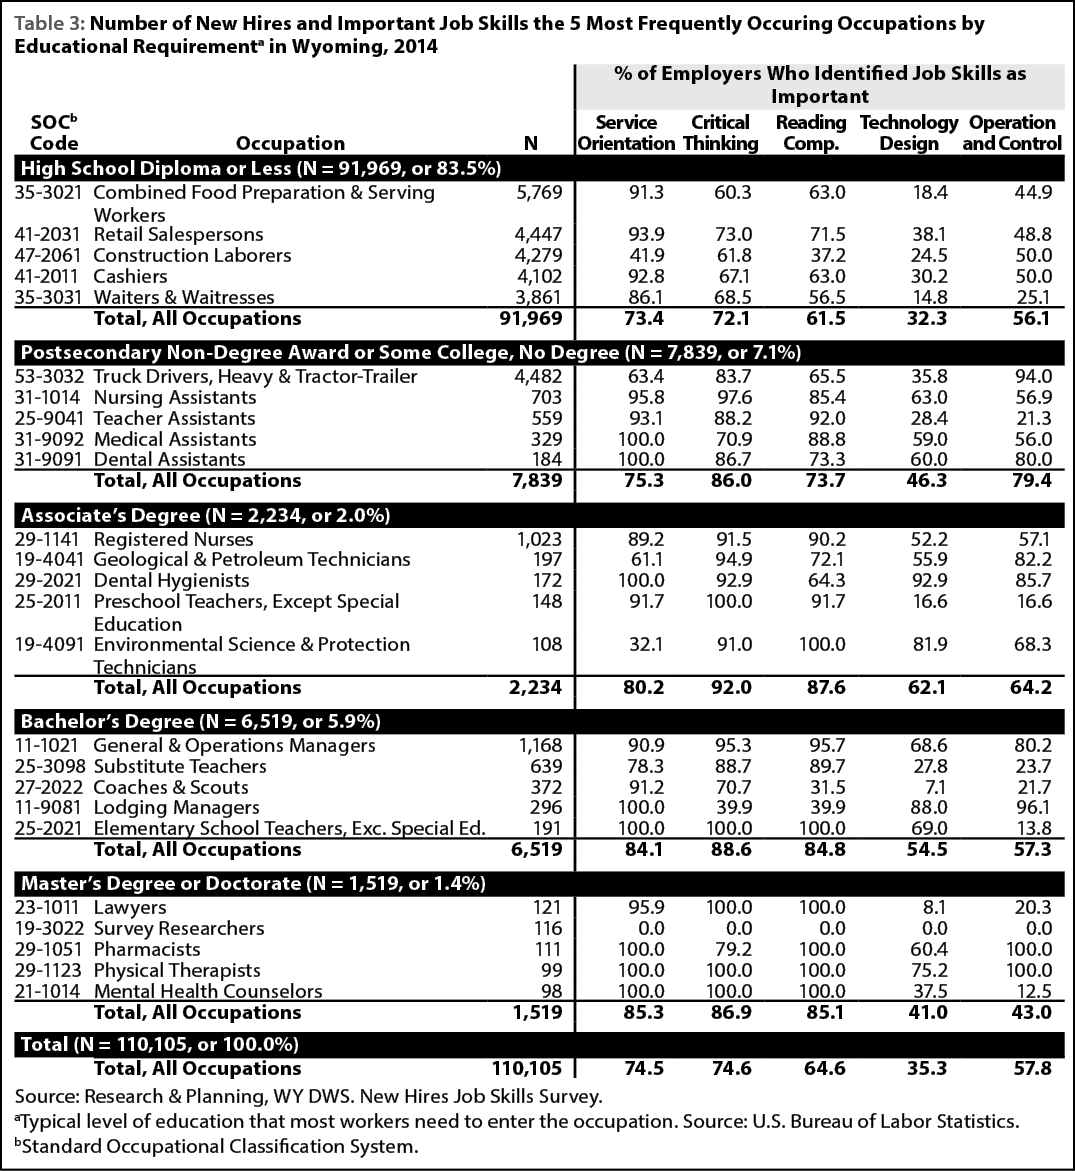
Operation & control, defined as “controlling operations of equipment or systems,” was most important in occupations requiring a postsecondary non-degree award or some college and no degree (79.4%). A high percentage of employers identified this skill as important for occupations such as truck drivers, heavy & tractor-trailer (94.0%), computer user support specialists (96.5%), and telecommunications equipment installers & repairers (100.0%).
Employers who added new hires for occupations requiring a high school diploma or less placed the greatest emphasis on service orientation (73.4%), while only 32.3% identified technology design as an important skill. Many of the most frequently occurring occupations in the category are those that would require the jobholder to possess customer service or service orientation skills, such as combined food preparation & serving workers, retail salespersons, cashiers, and waiters & waitresses.
Retention and Employer Satisfaction
Employer feedback from the New Hires Survey provides R&P with an idea of employers’ satisfaction of new hires’ job skills. By linking survey data from the New Hires Survey to wage records, R&P is also able to determine which new hires were still working for the same employer in every quarter after hire. Information on tenure with the hiring employer is presented in Table 4 and illustrated in Figure 6.
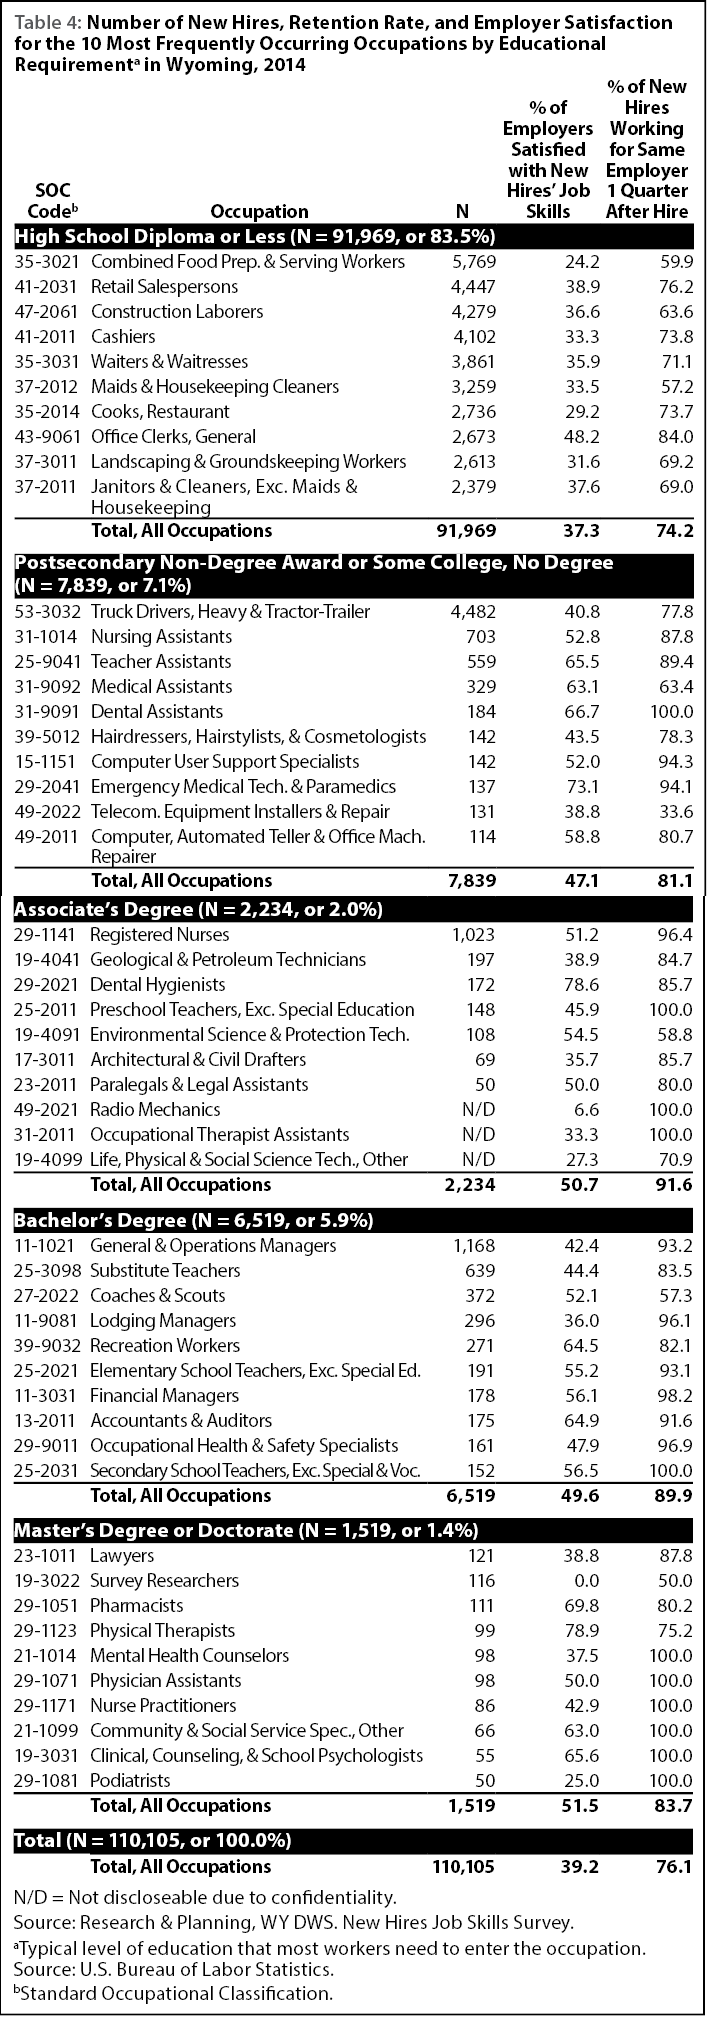
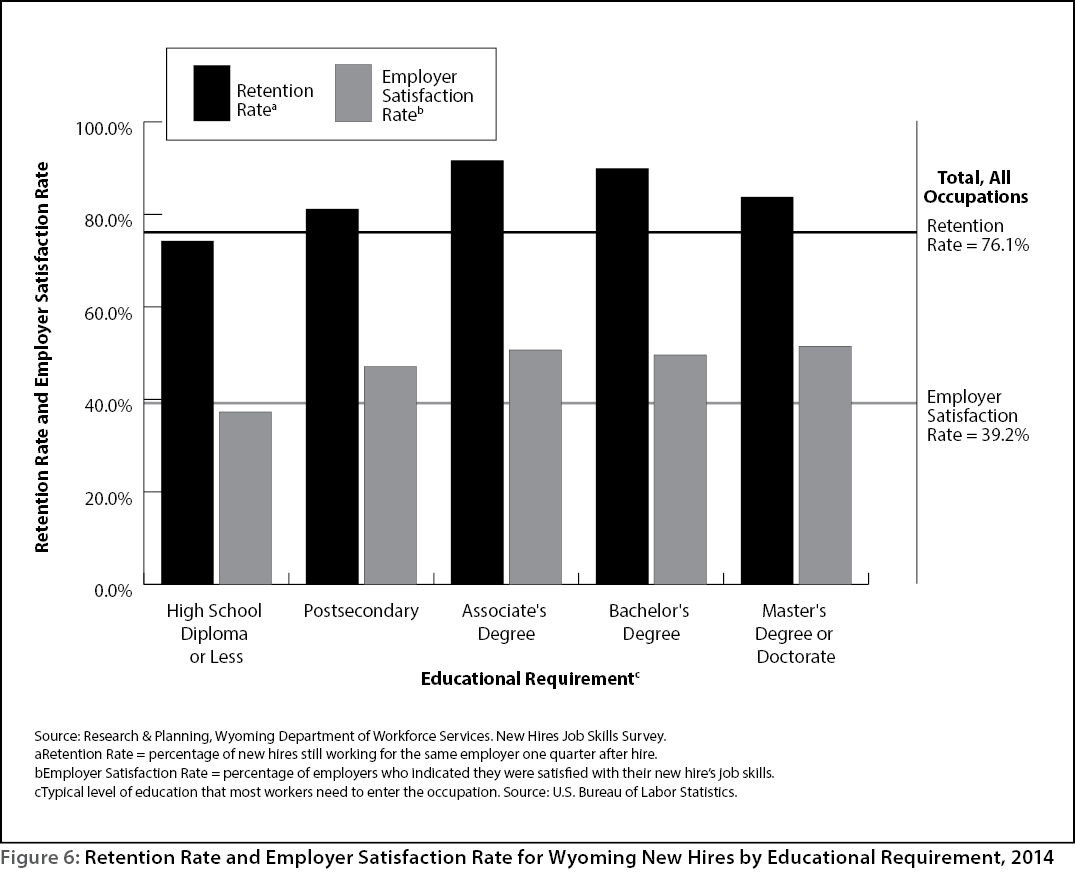
For the purpose of this article, retention rate is defined as the percentage of new hires still working for the same employer one quarter after hire. For all new hires in 2014, the average retention rate was 76.1%. At the educational requirement level, the retention rate varied from 74.2% for occupations requiring a high school diploma or less to 91.6% for occupations requiring an associate’s degree.
Employer satisfaction rate is defined as the percentage of employers who indicated they were satisfied with their new hire’s job skills; for all new hires in 2014, the employer satisfaction rate was 39.2%. The employer satisfaction rate varied from 37.3% for occupations requiring a high school diploma or less to 51.5% for occupations requiring a master’s degree or doctorate.
Retention rate and employer satisfaction rate both appear to be related to an occupation’s educational requirement. Employers may spend more time recruiting, screening, and training new hires for occupations that require education beyond a high school diploma in order to make sure those individuals meet their needs. Because of this, employers may be more satisfied with the skills of workers they have spent more time, money, and effort hiring, and these workers may be retained at a higher rate. Conversely, employers may not be as selective when filling low-paying or temporary jobs. An alternative or complementary idea is that formal education may be associated with greater opportunity to learn social skills that lead to greater employer satisfaction.
For example, in 2014 Wyoming employers added an estimated 4,279 new hires as construction laborers, but only 63.6% of those new hires were still working for the same employer one quarter after hire. This lower retention rate may be a function of the type of job for which workers were hired. The employer may have hired construction laborers specifically for July and August; in that case, those construction laborers would be identified as new hires for that employer during third quarter (July, August, and September) but would not show up in R&P’s Wage Records database with that employer in fourth quarter (October, November, and December) as the outdoor construction season tends to come to a close.
In contrast, occupations such as dental assistants (postsecondary non-degree award) and registered nurses (associate’s degree) had higher retention rates (100.0% and 96.4%, respectively) and employer satisfaction rates (66.7% and 51.2%, respectively). Employers who were looking to fill these types of jobs may have been more selective about the workers they hired in order to find the individuals who best fit their needs.
Gender and Age
New Hires Survey results linked to administrative databases can be used to identify demographic trends in Wyoming’s labor market. Across all occupations and education levels, 48.2% of all new hires were males and 35.3% were females. However, as shown in Table 5 gender and age varied by educational requirement and occupation. For example, the majority of occupations requiring an associate’s degree (62.1%) were filled by female new hires. This is likely due to the fact that registered nurses accounted for nearly half (45.8%) of all new hires occupations requiring an associate’s degree, and 80.2% of all newly hired registered nurses were females.
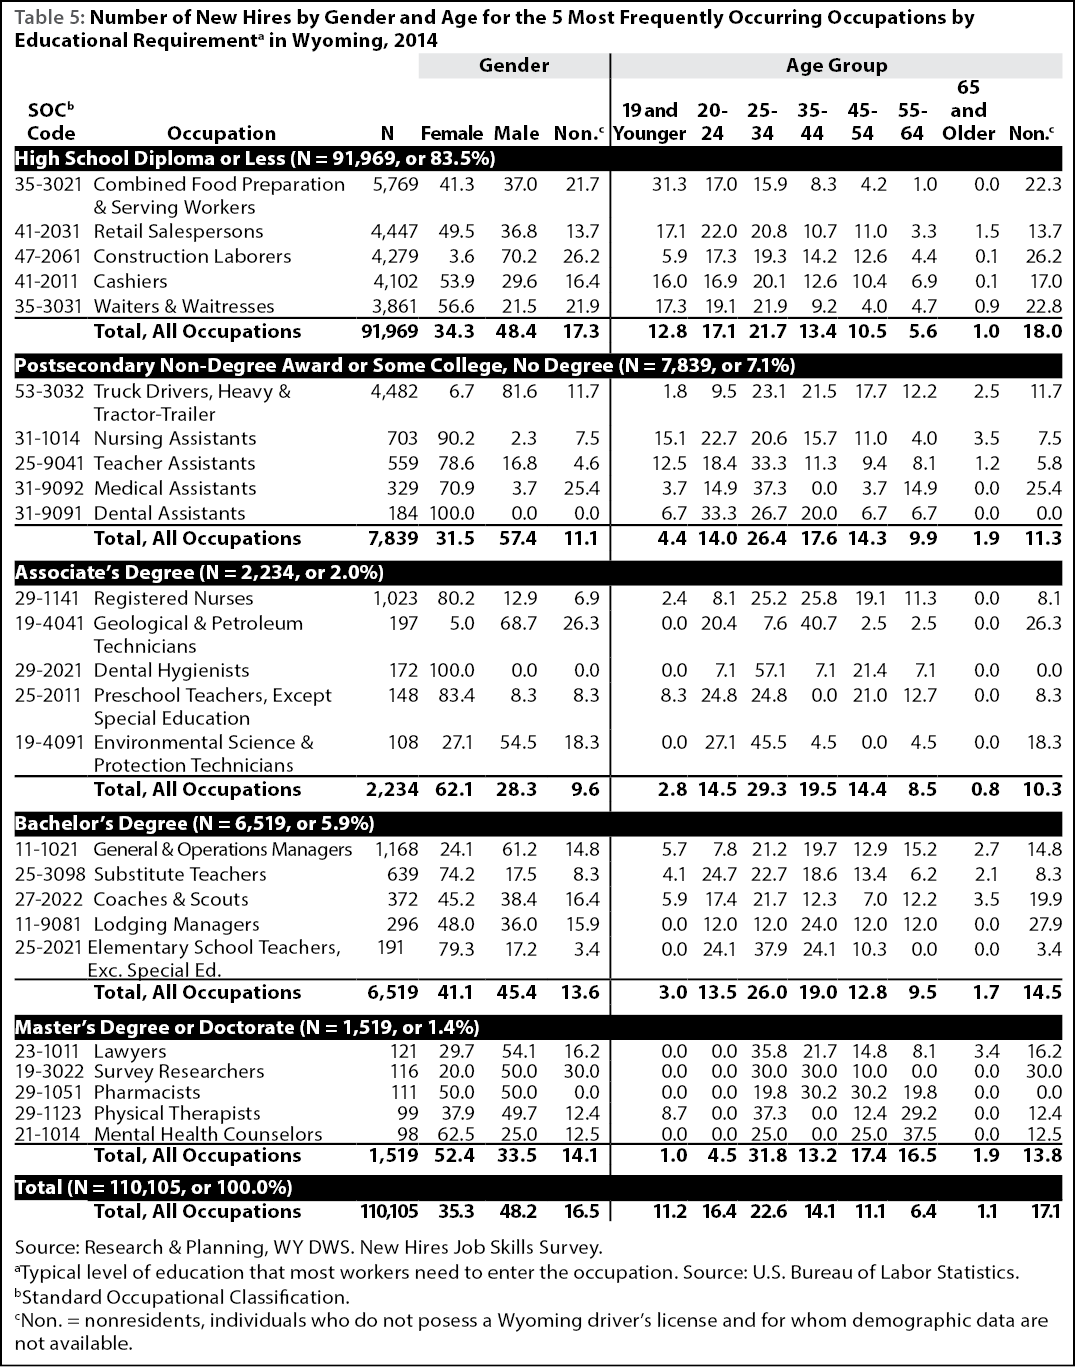
The majority of all new hires were younger, and in many occupations the 25-34 age group accounted for the largest proportion of new hires; 22.6% of all new hires fell in the 25-34 age range. In some cases, however, Wyoming employers turned to older workers to fill jobs. For example, 16.5% of all new hires occupations requiring a master’s degree or doctorate were filled by individuals ages 55-64. These included pharmacists (19.8%), physical therapists (29.2%), and mental health counselors (37.5%).
Demographic data for the remaining 17.1% of all new hires are not available; for the purpose of this article, these individuals are referred to as nonresidents. These are individuals for whom demographic data could not be found in any of R&P’s administrative databases, such as the driver’s license file obtained through a memorandum of understanding with the Wyoming Department of Transportation. Nonresidents are often hired to fill seasonal jobs that do not require any education beyond a high school diploma. This can be seen in Table 5, which shows that in 2014, 26.2% of all construction laborers and 21.9% of waiters & waitresses were nonresidents. Wyoming employers also hire nonresidents during periods of economic expansion after they have exhausted the local labor supply (Leonard, 2010).
Summary data from the New Hires Survey can be used to identify potential training needs for Wyoming educators and training providers (Knapp and Moore, 2014). For example, 26.3% of newly hired geological & petroleum technicians (associate’s degree) and 30.0% of newly hired survey researchers (master’s degree) were nonresidents. This may be an indication that Wyoming employers are not finding enough trained candidates to fill these jobs locally, and are recruiting from other states to fill them.
Conclusion and Future Research
Research & Planning has now collected more than five years’ worth of New Hires Survey data. As more data are collected, R&P will be able to identify hiring trends and determine how these patterns have changed over time and with economic conditions. For example, R&P began collecting New Hires Survey data in 2009Q4, when Wyoming was entering an economic downturn. Since then, much of the data was collected as the state recovered from that downturn. However, as noted by Liu (2015), lower oil and natural gas prices and the decline in the number of drilling rigs exploring for oil and natural gas resulted in job losses in Wyoming’s natural resources & mining industry during the first half of 2015. R&P will be able to determine how this slowdown impacted employers and jobseekers once New Hires Survey data are collected and reviewed for the first and second quarters of 2015.
References
Gosar, W. (1995). Wyoming unemployment insurance wage record summary statistics – a new way to look at Wyoming. Wyoming Labor Force Trends, 32(5). Retrieved September 4, 2015, from http://doe.state.wy.us/LMI/0595/0595toc.htm
Knapp, L., and Moore, M. (2014). Using new hires survey data to identify training opportunities. Wyoming Labor Force Trends, 51(7). Retrieved August 26, 2015, from http://doe.state.wy.us/LMI/trends/0714/a2.htm
Leonard, D. (2010). Commuting and unemployment insurance claims: evidence from Natrona County. Wyoming Labor Force Trends, 47(7). Retrieved August 26, 2015, from http://doe.state.wy.us/LMI/0710/a8.htm
Liu, W. (2015). State of Wyoming Department of Administration and Information Economic Analysis Division. Economic Summary: 1Q2015. Retrieved July 17, 2015, from http://eadiv.state.wy.us/wef/Economic_Summary1Q15.pdf