
 An Update on Nursing Employment in Wyoming
(Tables and Figures)
See Related Article
| 2009Q1 | 2009Q2 | 2009Q3 | 2009Q4 | 2010Q1 | 2010Q2 | 2010Q3 | 2010Q4 | 2011Q1 | ||
|---|---|---|---|---|---|---|---|---|---|---|
| Active RNs & APRNs | 802 | 794 | 822 | 840 | 859 | 863 | 875 | 874 | 911 | |
| % Change Prev. Qtr. | -1.2% | -1.0% | 3.5% | 2.2% | 2.3% | 0.5% | 1.4% | -0.1% | 4.2% | |
| % Change Prev. Year | 4.2% | -1.2% | 3.7% | 3.4% | 7.1% | 8.7% | 6.4% | 4.0% | 6.1% | |
| RN & APRN% of Total Employment | 9.8% | 9.6% | 9.7% | 9.8% | 10.0% | 9.9% | 9.9% | 10.0% | 10.3% | |
| Multiple Jobholders (RN & APRN) | 161 | 156 | 176 | 166 | 168 | 167 | 173 | 176 | 179 | |
| % Change Previous Quarter | -9.0% | -3.1% | 12.8% | -5.7% | 1.2% | -0.6% | 3.6% | 1.7% | 1.7% | |
| % Change Previous Year | -9.0% | -23.5% | -5.4% | -6.2% | 4.3% | 7.1% | -1.7% | 6.0% | 6.5% | |
|
Unemployment Insurance Claimants (RN & APRN) |
8 | 9 | 18 | 19 | 8 | 8 | 20 | 12 | 21 | |
| Claimant Rate | 1.0% | 1.1% | 2.2% | 2.3% | 0.9% | 0.9% | 2.3% | 1.4% | 2.3% | |
|
Worker's Compensation Claimants (RN & APRN) |
9 | 13 | 11 | 13 | 8 | 11 | 6 | 12 | 9 | |
| Claimant Rate | 1.1% | 1.6% | 1.3% | 1.5% | 0.9% | 1.3% | 0.7% | 1.4% | 1.0% | |
| Avg. Wages, Continuous RNs Only | $11,898 | $12,030 | $12,242 | $13,763 | $12,042 | $12,699 | $12,602 | $13,898 | N.A. | |
| Avg. Wages, Continuous APRNs Only | $18,953 | $19,052 | $19,448 | $22,045 | $18,856 | $19,606 | $20,783 | $23,278 | N.A. | |
| Avg. Age, All RNs & APRNs | 44.7 | 44.9 | 44.7 | 45.0 | 45.1 | 45.5 | 45.5 | 45.9 | 45.5 | |
| Avg. Tenure, All RNs & APRNs (Years) | 3.4 | 3.5 | 3.5 | 3.6 | 3.7 | 3.7 | 3.7 | 3.7 | 3.7 | |
| Exit Rate Percentage (RN & APRN) | 8.7% | 10.8% | 10.7% | 12.4% | 8.5% | 9.7% | 8.7% | 10.9% | N.A. | |
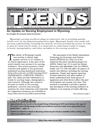
| Age | ||||||||||
| <25 | N | 39 | 40 | 40 | 35 | 28 | 23 | 26 | 25 | 24 |
| % | 4.9% | 5.0% | 4.9% | 4.2% | 3.3% | 2.7% | 3.0% | 2.9% | 2.6% | |
| 25-34 | N | 154 | 156 | 179 | 178 | 201 | 192 | 193 | 191 | 197 |
| % | 19.2% | 19.6% | 21.8% | 21.2% | 23.4% | 22.2% | 22.1% | 21.9% | 21.6% | |
| 35-44 | N | 195 | 182 | 180 | 178 | 175 | 181 | 179 | 179 | 206 |
| % | 24.3% | 22.9% | 21.9% | 21.2% | 20.4% | 21.0% | 20.5% | 20.5% | 22.6% | |
| 45-54 | N | 237 | 234 | 228 | 253 | 237 | 243 | 247 | 238 | 241 |
| % | 29.6% | 29.5% | 27.7% | 30.1% | 27.6% | 28.2% | 28.2% | 27.2% | 26.5% | |
| 55-64 | N | 149 | 153 | 164 | 163 | 182 | 185 | 190 | 196 | 208 |
| % | 18.6% | 19.3% | 20.0% | 19.4% | 21.2% | 21.4% | 21.7% | 22.4% | 22.8% | |
| 65+ | N | 28 | 28 | 30 | 33 | 36 | 39 | 40 | 45 | 34 |
| % | 3.5% | 3.5% | 3.6% | 3.9% | 4.2% | 4.5% | 4.6% | 5.1% | 3.7% | |
| NA = Not available. | ||||||||||
| ND = Not discloseable. | ||||||||||
| 2009Q1 | 2009Q2 | 2009Q3 | 2009Q4 | 2010Q1 | 2010Q2 | 2010Q3 | 2010Q4 | 2011Q1 | ||
|---|---|---|---|---|---|---|---|---|---|---|
| Active RNs & APRNs | 2,700 | 2,735 | 2,728 | 2,726 | 2,709 | 2,739 | 2,758 | 2,752 | 2,727 | |
| % Change Prev. Qtr. | 1.0% | 1.3% | -0.3% | -0.1% | -0.6% | 1.1% | 0.7% | -0.2% | -0.9% | |
| % Change Prev. Year | 4.1% | 4.1% | 2.1% | 2.0% | 0.3% | 0.1% | 1.1% | 1.0% | 0.7% | |
| RN & APRN% of Total Employment | 27.4% | 27.5% | 27.3% | 27.7% | 27.7% | 27.6% | 27.5% | 27.7% | 27.4% | |
| Multiple Jobholders (RN & APRN) | 225 | 259 | 207 | 227 | 199 | 243 | 244 | 241 | 207 | |
| % Change Previous Quarter | -8.9% | 15.1% | -20.1% | 9.7% | -12.3% | 22.1% | 0.4% | -1.2% | -14.1% | |
| % Change Previous Year Year | -13.8% | 10.2% | -15.5% | -8.1% | -11.6% | -6.2% | 17.9% | 6.2% | 4.0% | |
|
Unemployment Insurance Claimants (RN & APRN) |
9 | 16 | 16 | 11 | 20 | 13 | 16 | 15 | 15 | |
| Claimant Rate | 0.3% | 0.6% | 0.6% | 0.4% | 0.7% | 0.5% | 0.6% | 0.5% | 0.6% | |
|
Worker's Compensation Claimants (RN & APRN) |
47 | 41 | 51 | 59 | 48 | 58 | 64 | 63 | 53 | |
| Claimant Rate | 1.7% | 1.5% | 1.9% | 2.2% | 1.8% | 2.1% | 2.3% | 2.3% | 1.9% | |
| Avg. Wages, Continuous RNs Only | $14,483 | $14,906 | $15,215 | $16,305 | $14,243 | $15,055 | $15,845 | $17,084 | N.A. | |
| Avg. Wages, Continuous APRNs Only | $28,267 | $28,574 | $31,032 | $30,916 | $29,592 | $29,140 | $33,773 | $34,953 | N.A. | |
| Avg. Age, All RNs & APRNs | 46.9 | 47.7 | 47.0 | 47.4 | 47.6 | 47.1 | 47.3 | 47.6 | 47.8 | |
| Avg. Tenure, All RNs & APRNs (Years) | 6.5 | 6.5 | 6.5 | 6.6 | 6.7 | 6.7 | 6.7 | 6.8 | 7.0 | |
| Exit Rate Percentage (RN & APRN) | 4.8% | 5.0% | 4.8% | 4.6% | 3.9% | 5.3% | 4.9% | 5.6% | N.A. | |
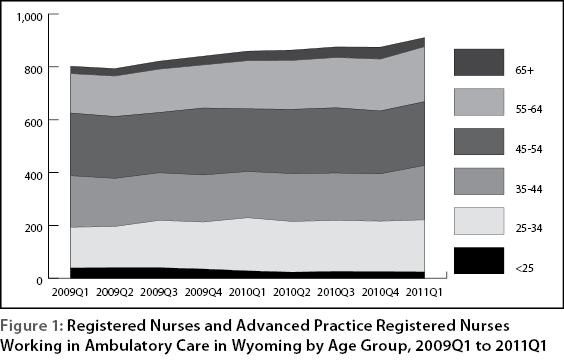
| Age | ||||||||||
| <25 | N | 132 | 137 | 158 | 145 | 137 | 133 | 140 | 140 | 123 |
| % | 4.9% | 5.0% | 5.8% | 5.3% | 5.1% | 4.9% | 5.1% | 5.1% | 4.5% | |
| 25-34 | N | 667 | 673 | 662 | 668 | 672 | 696 | 704 | 679 | 673 |
| % | 24.7% | 24.6% | 24.3% | 24.5% | 24.8% | 25.4% | 25.5% | 24.7% | 24.7% | |
| 35-44 | N | 627 | 645 | 628 | 621 | 624 | 643 | 647 | 653 | 650 |
| % | 23.2% | 23.6% | 23.0% | 22.8% | 23.0% | 23.5% | 23.5% | 23.7% | 23.8% | |
| 45-54 | N | 767 | 763 | 756 | 748 | 711 | 694 | 691 | 691 | 687 |
| % | 28.4% | 27.9% | 27.7% | 27.4% | 26.2% | 25.3% | 25.1% | 25.1% | 25.2% | |
| 55-64 | N | 456 | 467 | 469 | 487 | 502 | 514 | 513 | 527 | 532 |
| % | 16.9% | 17.1% | 17.2% | 17.9% | 18.5% | 18.8% | 18.6% | 19.1% | 19.5% | |
| 65+ | N | 49 | 49 | 54 | 55 | 61 | 57 | 61 | 60 | 60 |
| % | 1.8% | 1.8% | 2.0% | 2.0% | 2.3% | 2.1% | 2.2% | 2.2% | 2.2% | |
| NA = Not available. | ||||||||||
| ND = Not discloseable. | ||||||||||
| 2009Q1 | 2009Q2 | 2009Q3 | 2009Q4 | 2010Q1 | 2010Q2 | 2010Q3 | 2010Q4 | 2011Q1 | ||
|---|---|---|---|---|---|---|---|---|---|---|
| Active RNs & APRNs | 396 | 401 | 408 | 407 | 403 | 395 | 401 | 398 | 390 | |
| % Change Prev. Qtr. | 10.0% | 1.3% | 1.7% | -0.2% | -1.0% | -2.0% | 1.5% | -0.7% | -2.0% | |
| % Change Prev. Year | 7.9% | 9.6% | 12.7% | 13.1% | 1.8% | -1.5% | -1.7% | -2.2% | -3.2% | |
| RN & APRN% of Total Employment | 7.9% | 8.0% | 8.1% | 8.3% | 8.3% | 8.0% | 8.0% | 8.1% | 8.0% | |
| Multiple Jobholders (RN & APRN) | 84 | 80 | 64 | 80 | 78 | 75 | 83 | 97 | 78 | |
| % Change Previous Quarter | 15.1% | -4.8% | -20.0% | 25.0% | -2.5% | -3.8% | 10.7% | 16.9% | -19.6% | |
| % Change Previous Year | 33.3% | 12.7% | -7.2% | 9.6% | -7.1% | -6.3% | 29.7% | 21.3% | 0.0% | |
| Unemployment Insurance Claimants (RN & APRN) |
6 | 7 | 13 | 8 | 8 | 10 | 16 | 14 | 15 | |
| Claimant Rate | 1.5% | 1.7% | 3.2% | 2.0% | 2.0% | 2.5% | 4.0% | 3.5% | 3.8% | |
| Worker's Compensation Claimants (RN & APRN) |
11 | 8 | 6 | N.D. | 6 | 6 | 7 | 9 | 5 | |
| Claimant Rate | 2.8% | 2.0% | 1.5% | N.D. | 1.5% | 1.5% | 1.7% | 2.3% | 1.3% | |
| Avg. Wages, Continuous RNs Only | $12,555 | $12,813 | $12,837 | $13,104 | $12,758 | $13,964 | $13,910 | $14,719 | N.A. | |
| Avg. Wages, Continuous APRNs Only | N.D. | N.D. | N.D. | N.D. | N.D. | N.D. | N.D. | N.D. | N.A. | |
| Avg. Age, All RNs & APRNs | 44.4 | 44.7 | 44.5 | 45.1 | 45.9 | 46.6 | 46.9 | 47.0 | 47.2 | |
| Avg. Tenure, All RNs & APRNs (Years) | 3.4 | 3.4 | 3.6 | 3.6 | 3.7 | 3.8 | 3.7 | 3.9 | 3.7 | |
| Exit Rate Percentage (RN & APRN) | 11.4% | 10.7% | 9.6% | 9.3% | 10.4% | 12.2% | 12.2% | 13.3% | N.A. | |
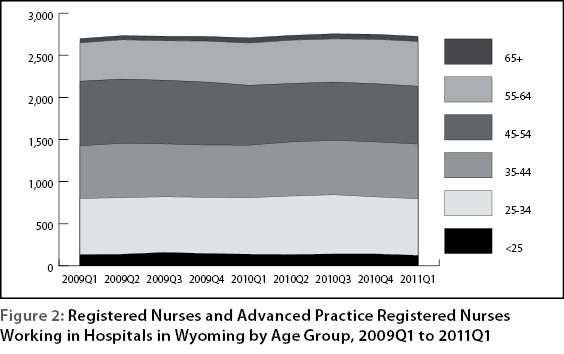
| Age | ||||||||||
| <25 | N | 44 | 41 | 32 | 23 | 20 | 14 | 14 | 15 | 16 |
| % | 11.1% | 10.2% | 7.8% | 5.7% | 5.0% | 3.5% | 3.5% | 3.8% | 4.1% | |
| 25-34 | N | 74 | 79 | 92 | 95 | 87 | 83 | 76 | 79 | 71 |
| % | 18.7% | 19.7% | 22.5% | 23.3% | 21.6% | 21.0% | 19.0% | 19.8% | 18.2% | |
| 35-44 | N | 66 | 68 | 73 | 71 | 72 | 71 | 74 | 70 | 71 |
| % | 16.7% | 17.0% | 17.9% | 17.4% | 17.9% | 18.0% | 18.5% | 17.6% | 18.2% | |
| 45-54 | N | 114 | 106 | 107 | 106 | 109 | 106 | 111 | 107 | 103 |
| % | 28.8% | 26.4% | 26.2% | 26.0% | 27.0% | 26.8% | 27.7% | 26.9% | 26.4% | |
| 55-64 | N | 79 | 86 | 85 | 94 | 91 | 94 | 100 | 100 | 101 |
| % | 19.9% | 21.4% | 20.8% | 23.1% | 22.6% | 23.8% | 24.9% | 25.1% | 25.9% | |
| 65+ | N | 19 | 21 | 19 | 18 | 24 | 27 | 26 | 27 | 28 |
| % | 4.8% | 5.2% | 4.7% | 4.4% | 6.0% | 6.8% | 6.5% | 6.8% | 7.2% | |
| NA = Not available. | ||||||||||
| ND = Not disclosable. | ||||||||||
| Employment Status | Total | ||||||||
|---|---|---|---|---|---|---|---|---|---|
| Continuous | Turnoverb | ||||||||
| County of Work | N | Column % | Average Wage | N | Column % | Average Wage | N | Column % | Average Wage |
| Natrona | 730 | 20.9% | $17,749 | 117 | 22.1% | $11,437 | 847 | 21.0% | $16,877 |
| Laramie | 661 | 18.9% | $16,554 | 112 | 21.1% | $9,774 | 773 | 19.2% | $15,572 |
| Campbell | 246 | 7.0% | $17,870 | 28 | 5.3% | $12,967 | 274 | 6.8% | $17,369 |
| Park | 253 | 7.2% | $16,478 | 33 | 6.2% | $10,233 | 286 | 7.1% | $15,757 |
| Albany | 197 | 5.6% | $16,721 | 37 | 7.0% | $10,241 | 234 | 5.8% | $15,696 |
| Fremont | 226 | 6.5% | $14,994 | 33 | 6.2% | $11,306 | 259 | 6.4% | $14,524 |
| Sheridan | 197 | 5.6% | $16,673 | 27 | 5.1% | $9,291 | 224 | 5.6% | $15,783 |
| Other Countiesa | 984 | 28.2% | $16,429 | 143 | 27.0% | $12,438 | 1,127 | 28.0% | $15,923 |
| Total | 3,494 | 100.0% | $16,771 | 530 | 100.0% | $11,161 | 4,024 | 100.0% | $16,032 |
| aOther Wyoming counties were aggregated to protect confidentiality. | |||||||||
| bHire, exit, or both hire and exit. | |||||||||