

New Publication Examines Wyoming's Education Labor Market
Wyoming teachers working in public schools earned considerably more on average than teachers in all other surrounding states, according to a new report from the Research & Planning (R&P) section of the Wyoming Department of Workforce Services.
 |
R&P was funded by the Wyoming Legislature to collect and analyze data related to the labor market of Wyoming school districts and student outcomes of the Hathaway Student Scholarship Program. The first part of this analysis provides a comparison of employment and wages in local government schools (North American Industry Classification System 611110) in Wyoming and surrounding states and is available in Monitoring School District Human Resource Cost Pressures.
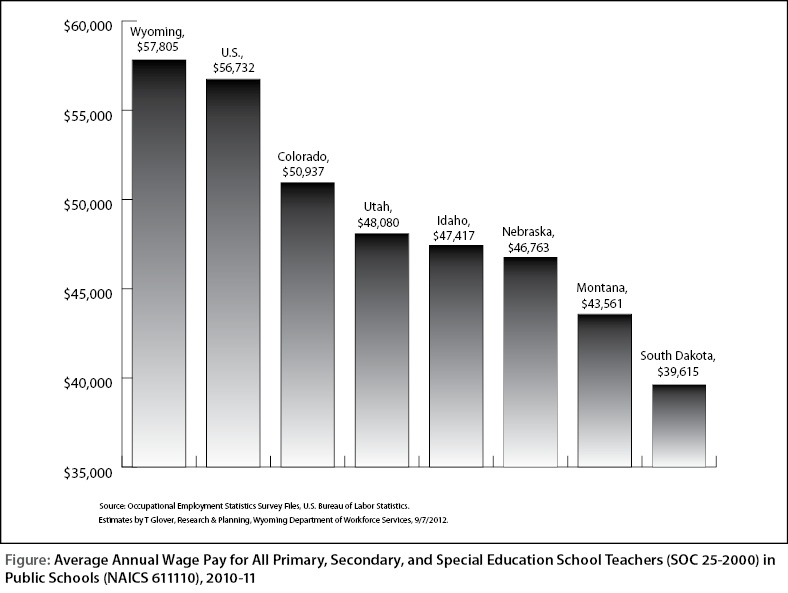
On average, primary, secondary, and special education school teachers (Standard Occupational Classification [SOC] 25-2000) in Wyoming were paid $57,805 annually during the 2010-11 school year (see Figure 1). Teachers in Colorado had the closest average annual wage ($50,937, or -1.9%), while teachers in South Dakota had an average annual wage of $39,615 (-31.5%).
While wages for primary, secondary, and special education school teachers were higher in Wyoming than in all surrounding states, wages varied among Wyoming counties in 2010-11. According to Wyoming Department of Education contract files, nine counties had an average annual wage higher than the statewide average of $57,805, while 14 counties had a lower annual wage. The average annual wage for all primary, secondary, and special education school teachers was highest in Teton ($63,926) and Campbell ($61,206) counties, and lowest in Niobrara ($46,012) and Albany ($51,876) counties.
The report also examines aging and turnover trends among teachers in public schools in Wyoming. Statewide, 21.8% of all primary, secondary, and special education school teachers in public schools were age 55 and older during the 2010-11 school year. In addition, 8.0% of all teachers left public schools between the 2010-11 and 2011-12 school years.
Some smaller, rural counties are faced with an even higher percentage of teachers age 55 and older and of teachers leaving public schools (see Table 1). In Weston County, for example, 29.7% of all teachers were age 55 and older, and 11.9% of all teachers left public schools between 2010-11 and 2011-12.
This publication also examines where workers go when they leave public schools, and what kinds of wages they earn. In most cases, teachers who left employment in public schools earned substantially less in their new occupation. Workers in non-teaching jobs in public schools, however, often left for jobs outside of public schools that paid considerably more.
In addition to a high percentage of teachers reaching the traditional retirement age of 65 within the next 10 years, Wyoming's educational services industry also has a high percentage of workers (61.4%) who hold a bachelor's degree or higher. As many of these workers age out of the workforce, these jobs will need to be filled by well-educated workers.
Monitoring School District Human Resource Cost Pressures is available online at http://doe.state.wy.us/LMI/education_costs.htm. In addition to this publication and an accompanying presentation, this site also contains detailed tables for all occupations found in public schools.
| County |
Contract Employment, 2010/11 |
Workers Age 55 and Older |
Total Leavers |
||
|---|---|---|---|---|---|
| N | % | N |
Exit Rate |
||
| Albany | 347 | 73 | 21.0% | 30 | 8.6% |
| Big Horn | 208 | 53 | 25.5% | 21 | 10.1% |
| Campbell | 655 | 133 | 20.3% | 37 | 5.6% |
| Carbon | 240 | 65 | 27.1% | 25 | 10.4% |
| Converse | 215 | 44 | 20.5% | 21 | 9.8% |
| Crook | 105 | 30 | 28.6% | 9 | 8.6% |
| Fremont | 564 | 153 | 27.1% | 58 | 10.3% |
| Goshen | 171 | 37 | 21.6% | 12 | 7.0% |
| Hot Springs | 66 | 19 | 28.8% | 14 | 21.2% |
| Johnson | 121 | 20 | 16.5% | 13 | 10.7% |
| Laramie | 1,087 | 207 | 19.0% | 49 | 4.5% |
| Lincoln | 244 | 54 | 22.1% | 15 | 6.1% |
| Natrona | 879 | 149 | 17.0% | 72 | 8.2% |
| Niobrara | 59 | 9 | 15.3% | 3 | 5.1% |
| Park | 323 | 69 | 21.4% | 24 | 7.4% |
| Platte | 143 | 47 | 32.9% | 13 | 9.1% |
| Sheridan | 371 | 88 | 23.7% | 26 | 7.0% |
| Sublette | 140 | 17 | 12.1% | 19 | 13.6% |
| Sweetwater | 589 | 155 | 26.3% | 56 | 9.5% |
| Teton | 221 | 39 | 17.6% | 25 | 11.3% |
| Uinta | 362 | 79 | 21.8% | 28 | 7.7% |
| Washakie | 134 | 32 | 23.9% | 5 | 3.7% |
| Weston | 101 | 30 | 29.7% | 12 | 11.9% |
| Wyoming | 7,345 | 1,602 | 21.8% | 587 | 8.0% |
| Source: Wyoming Department of Education Contract Files (WDE 602). | |||||