Initial Claims
|
Claims Filed
|
%
Change
Claims
Filed |
Aug
14 |
Aug
14 |
Aug
14 |
Jul
14 |
Aug
13 |
Jul
14 |
Aug
13 |
|
Wyoming Statewide
|
|
TOTAL CLAIMS FILED
|
1,462
|
1,495
|
2,082
|
-2.2
|
-29.8
|
|
TOTAL GOODS-PRODUCING
|
512
|
451
|
736
|
13.5
|
-30.4
|
|
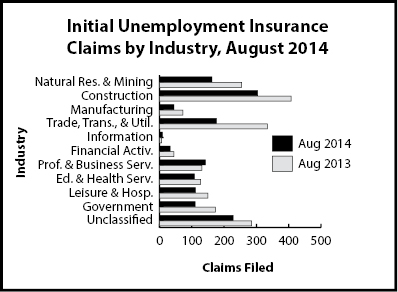
Natural Res. & Mining
|
162
|
156
|
254
|
3.8
|
-36.2
|
|
Mining
|
156
|
139
|
246
|
12.2
|
-36.6
|
|
Oil & Gas Extraction
|
8
|
6
|
12
|
33.3
|
-33.3
|
|
Construction
|
304
|
264
|
408
|
15.2
|
-25.5
|
|
Manufacturing
|
44
|
29
|
72
|
51.7
|
-38.9
|
|
TOTAL SERVICE-PROVIDING
|
611
|
642
|
887
|
-4.8
|
-31.1
|
|
Trade, Transp., & Utilities
|
176
|
206
|
334
|
-14.6
|
-47.3
|
|
Wholesale Trade
|
43
|
40
|
147
|
7.5
|
-70.7
|
|
Retail Trade
|
92
|
109
|
117
|
-15.6
|
-21.4
|
|
Transp., Warehousing & Utilities
|
41
|
57
|
70
|
-28.1
|
-41.4
|
|
Information
|
9
|
12
|
6
|
-25.0
|
50.0
|
|
Financial Activities
|
33
|
45
|
44
|
-26.7
|
-25.0
|
|
Prof. & Business Svcs.
|
142
|
111
|
131
|
27.9
|
8.4
|
|
Educational & Health Svcs.
|
108
|
108
|
127
|
0.0
|
-15.0
|
|
Leisure & Hospitality
|
111
|
123
|
150
|
-9.8
|
-26.0
|
|
Other Svcs., exc. Public Admin.
|
24
|
30
|
88
|
-20.0
|
-72.7
|
|
TOTAL GOVERNMENT
|
110
|
171
|
173
|
-35.7
|
-36.4
|
|
Federal Government
|
31
|
34
|
32
|
-8.8
|
-3.1
|
|
State Government
|
10
|
15
|
27
|
-33.3
|
-63.0
|
|
Local Government
|
68
|
121
|
113
|
-43.8
|
-39.8
|
|
Local Education
|
21
|
32
|
20
|
-34.4
|
5.0
|
|
UNCLASSIFIED
|
228
|
230
|
285
|
-0.9
|
-20.0
|
|
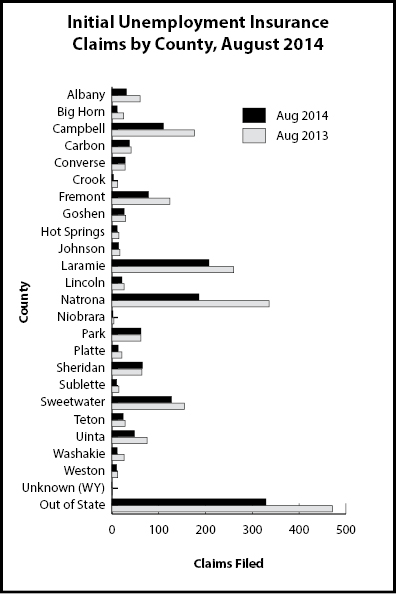
Laramie County
|
|
TOTAL CLAIMS FILED
|
206
|
227
|
259
|
-9.3
|
-20.5
|
|
TOTAL GOODS-PRODUCING
|
68
|
56
|
81
|
21.4
|
-16.0
|
|
Construction
|
55
|
43
|
67
|
27.9
|
-17.9
|
|
TOTAL SERVICE-PROVIDING
|
106
|
132
|
148
|
-19.7
|
-28.4
|
|
Trade, Transp., & Utilities
|
28
|
36
|
54
|
-22.2
|
-48.1
|
|
Financial Activities
|
6
|
14
|
10
|
-57.1
|
-40.0
|
|
Prof. & Business Svcs.
|
58
|
49
|
23
|
18.4
|
152.2
|
|
Educational & Health Svcs.
|
12
|
13
|
26
|
-7.7
|
-53.8
|
|
Leisure & Hospitality
|
16
|
17
|
28
|
-5.9
|
-42.9
|
|
TOTAL GOVERNMENT
|
18
|
22
|
22
|
-18.2
|
-18.2
|
|
UNCLASSIFIED
|
14
|
16
|
7
|
-12.5
|
100.0
|
|
Natrona County
|
|
TOTAL CLAIMS FILED
|
186
|
193
|
335
|
-3.6
|
-44.5
|
|
TOTAL GOODS-PRODUCING
|
63
|
58
|
128
|
8.6
|
-50.8
|
|
Construction
|
42
|
25
|
50
|
68.0
|
-16.0
|
|
TOTAL SERVICE-PROVIDING
|
111
|
116
|
185
|
-4.3
|
-40.0
|
|
Trade, Transp., & Utilities
|
31
|
32
|
78
|
-3.1
|
-60.3
|
|
Financial Activities
|
8
|
11
|
8
|
-27.3
|
0.0
|
|
Prof. & Business Svcs.
|
28
|
22
|
23
|
27.3
|
21.7
|
|
Educational & Health Svcs.
|
25
|
26
|
21
|
-3.8
|
19.0
|
|
Leisure & Hospitality
|
17
|
14
|
17
|
21.4
|
0.0
|
|
TOTAL GOVERNMENT
|
6
|
12
|
15
|
-50.0
|
-60.0
|
|
UNCLASSIFIED
|
4
|
6
|
6
|
-33.3
|
-33.3
|
| aAn average month is considered 4.33 weeks. If a month has four weeks, the normalization factor is 1.0825. If the month has five weeks, the normalization factor is 0.866. The number of raw claims is multiplied by the normalization factor to achieve the normalized claims counts. |
|
Initial Claims by Industry
Initial Claims by County
|
