Wyoming Normalizeda Unemployment Insurance Statistics: Continued Claims
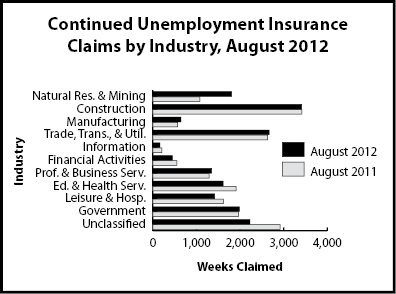
Although the total number of continued weeks claimed declined overall from August 2011 to August 2012, significant increases were seen in natural resources & mining (67.7%) and wholesale trade (37.5%).
| Continued Claims | Continued Weeks Claimed | Percent Change Weeks Claimed | ||||
|---|---|---|---|---|---|---|
| Aug 12 | Aug 12 | |||||
| Aug 12 | Jul 12 | Aug 11 | Jul 12 | Aug 11 | ||
| Wyoming Statewide | ||||||
| TOTAL WEEKS CLAIMED | 18,300 | 18,673 | 18,651 | -2.0 | -1.9 | |
| EXTENDED WEEKS CLAIMED | 5,744 | 6,587 | 12,670 | -12.8 | -54.7 | |
| TOTAL UNIQUE CLAIMANTSb | 4,419 | 5,300 | 4,480 | -16.6 | -1.4 | |
| Benefit Exhaustions | 440 | 463 | 541 | -5.0 | -18.7 | |
| Benefit Exhaustion Rates | 10.0% | 8.7% | 12.1% | 1.2% | -2.1% | |
| TOTAL GOODS-PRODUCING | 5,861 | 6,080 | 5,064 | -3.6 | 15.7 | |
| Natural Res. & Mining | 1,808 | 1,795 | 1,078 | 0.7 | 67.7 | |
| Mining | 1,668 | 1,639 | 940 | 1.8 | 77.4 | |
| Oil & Gas Extraction | 170 | 155 | 87 | 9.7 | 95.4 | |
| Construction | 3,412 | 3,625 | 3,419 | -5.9 | -0.2 | |
| Manufacturing | 641 | 660 | 567 | -2.9 | 13.1 | |
| TOTAL SERVICE-PROVIDING | 8,224 | 8,318 | 8,704 | -1.1 | -5.5 | |
| Trade, Transp., & Utilities | 2,669 | 2,591 | 2,633 | 3.0 | 1.4 | |
| Wholesale Trade | 598 | 464 | 435 | 28.9 | 37.5 | |
| Retail Trade | 1,419 | 1,467 | 1,648 | -3.3 | -13.9 | |
| Transp., Warehousing & Utilities | 652 | 660 | 550 | -1.2 | 18.5 | |
| Information | 162 | 146 | 204 | 11.0 | -20.6 | |
| Financial Activities | 446 | 437 | 551 | 2.1 | -19.1 | |
| Prof. & Business Services | 1,346 | 1,454 | 1,291 | -7.4 | 4.3 | |
| Educational & Health Svcs. | 1,611 | 1,649 | 1,911 | -2.3 | -15.7 | |
| Leisure & Hospitality | 1,418 | 1,552 | 1,620 | -8.6 | -12.5 | |
| Other Svcs., exc. Public Admin. | 572 | 489 | 494 | 17.0 | 15.8 | |
| TOTAL GOVERNMENT | 1,987 | 1,856 | 1,964 | 7.1 | 1.2 | |
| Federal Government | 307 | 296 | 335 | 3.7 | -8.4 | |
| State Government | 277 | 242 | 259 | 14.5 | 6.9 | |
| Local Government | 1,403 | 1,318 | 1,370 | 6.4 | 2.4 | |
| Local Education | 461 | 421 | 474 | 9.5 | -2.7 | |
| UNCLASSIFIED | 2,228 | 2,419 | 2,919 | -7.9 | -23.7 | |
| Laramie County | ||||||
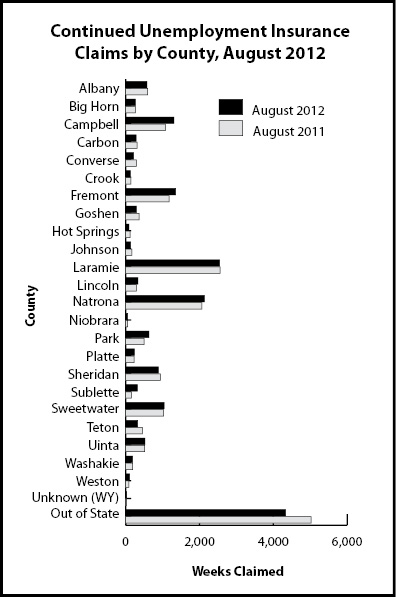
| TOTAL WEEKS CLAIMED | 2,544 | 2,539 | 2,559 | 0.2 | -0.6 | |
| TOTAL UNIQUE CLAIMANTS | 615 | 729 | 636 | -15.6 | -3.3 | |
| TOTAL GOODS-PRODUCING | 456 | 535 | 524 | -14.8 | -13.0 | |
| Construction | 328 | 366 | 404 | -10.4 | -18.8 | |
| TOTAL SERVICE-PROVIDING | 1,635 | 1,597 | 1,618 | 2.4 | 1.1 | |
| Trade, Transp., & Utilities | 508 | 478 | 429 | 6.3 | 18.4 | |
| Financial Activities | 115 | 110 | 118 | 4.5 | -2.5 | |
| Prof. & Business Svcs. | 307 | 323 | 274 | -5.0 | 12.0 | |
| Educational & Health Svcs. | 326 | 354 | 425 | -7.9 | -23.3 | |
| Leisure & Hospitality | 272 | 245 | 238 | 11.0 | 14.3 | |
| TOTAL GOVERNMENT | 359 | 304 | 323 | 18.1 | 11.1 | |
| UNCLASSIFIED | 94 | 103 | 94 | -8.7 | 0.0 | |
| Natrona County | ||||||
| TOTAL WEEKS CLAIMED | 2,131 | 1,953 | 2,065 | 9.1 | 3.2 | |
| TOTAL UNIQUE CLAIMANTS | 523 | 541 | 506 | -3.3 | 3.4 | |
| Total Goods-Producing | 593 | 551 | 522 | 7.6 | 13.6 | |
| Construction | 268 | 266 | 255 | 0.8 | 5.1 | |
| TOTAL SERVICE-PROVIDING | 1,343 | 1,231 | 1,368 | 9.1 | -1.8 | |
| Trade, Transp., & Utilities | 417 | 346 | 490 | 20.5 | -14.9 | |
| Financial Activities | 54 | 39 | 71 | 38.5 | -23.9 | |
| Professional & Business Svcs. | 186 | 188 | 167 | -1.1 | 11.4 | |
| Educational & Health Svcs. | 341 | 321 | 306 | 6.2 | 11.4 | |
| Leisure & Hospitality | 181 | 188 | 205 | -3.7 | -11.7 | |
| TOTAL GOVERNMENT | 125 | 105 | 129 | 19.0 | -3.1 | |
| UNCLASSIFIED | 70 | 66 | 46 | 6.1 | 52.2 | |
| aAn average month is considered 4.33 weeks. If a month has four weeks, the normalization factor is 1.0825. If the month has five weeks, the normalization factor is 0.866. The number of raw claims is multiplied by the normalization factor to achieve the normalized claims counts. bDoes not include claimants receiving extended benefits. |
||||||
|
||||||