

Will Wyoming's Unemployment Rate Return to 2008 Levels by the End of 2012?
See Related Tables and Figures
Will Wyoming's unemployment rate return to its 2008 level by the end of 2012? How many jobs need to be created to get back to the levels they were at in 2008? Answering these questions is not straightforward due to conceptual differences between the number of jobs and the number of unemployed.
First, unemployment is about individual persons, while multiple jobs may be held by a single individual. Second, these two types of data are collected under two different programs administered by the U.S. Department of Labor's Bureau of Labor Statistics (BLS). The Local Area Unemployment Statistics (LAUS) program, which produces statistics on the labor force such as the unemployment rate and employment, estimates these values based upon where individuals live. One of the inputs into the state unemployment rate is the Current Population Statistics (CPS). The CPS is a household survey, meaning every month the Census Bureau surveys a sample of households and asks them whether or not they are employed. In contrast, jobs are counted as part of the Current Employment Statistics (CES) program by where employers are located. The CES is an establishment survey, where the BLS sends surveys to a sample of employers each month, asking how many jobs they have at their businesses.
Abraham, Haltiwanger, Sandusky, and Spletzer (2009) tried to explain discrepancies that persist even after controlling for definitional differences between CPS and CES (2009). For example, a person may work in Colorado but reside in Wyoming. If that person loses his or her job, the lost job is counted for Colorado, but the person's unemployment is counted for Wyoming. If the person worked in two jobs in Colorado and lost both jobs, there would be two jobs lost counted for Colorado, but the person's unemployment would be counted once for Wyoming.
From 2006 to 2008, as Wyoming was experiencing a rapid economic expansion, many people came from other states for jobs. As the economy contracted, several people returned to the states from which they originally came. The consequences were that:
-
Wyoming lost more jobs than are reflected in the state's unemployment rate; and
-
Wyoming exported a portion of its unemployed, adding to other states' unemployment counts and related statistics.
Because of the dynamic nature of Wyoming's economy, it is difficult to predict how many people from other states would return to Wyoming once more jobs are available. On a national level, in-migration and out-migration to the labor market are not an issue, since it is more difficult to commute from country to country than it is to move from one state to another. Therefore, accounting for natural population growth on a national level is enough.
Another confounding factor is that some people hold more than one job. In 2011, approximately 7.5% of Wyoming workers held two or more jobs (Campbell, 2012). Furthermore, this rate tends to change from year to year. In 2008, 8.4% of Wyoming workers worked in two or more jobs; in 2009 it was 8.7%; and in 2010 it was 8.8% (Campbell, 2010, 2011). The level of multiple jobholding will influence both unemployment statistics and job level counts.
A third factor that influences the unemployment rate is the number of discouraged workers. Often when workers determine that there are not jobs available, they stop looking for employment. When this occurs, they are by LAUS definition no longer in the labor force and therefore not counted in the unemployment rate. Conversely when economic conditions improve, individuals not presently in the labor force may begin looking for work, which also affects LAUS data. However, it is difficult to predict if and when workers will re-enter or exit the labor force.
 |
 |
 |
 |
 |
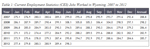
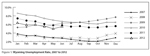
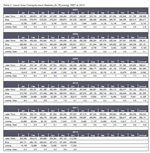
In December 2008 when Wyoming entered an economic downturn, the unemployment rate (not seasonally adjusted1) was 3.9% and the number of jobs in Wyoming was 297,100. Wyoming's unemployment rate steadily increased during that time to 8.6% in January 2010 and the number of jobs fell to 271,100. Since February 2010, the number of jobs in Wyoming also increased. Job numbers began to rise in over-the-year comparisons starting in August 2010 (see Table 1). Wyoming's unemployment rate has trended down during this period, with the exception of a seasonally-expected rise in the winter months (see Figure 1).
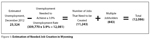
Estimation
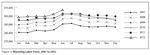
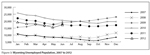
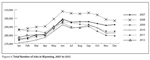
The research presented in this article calculates the estimation for length of time to reach the 2008 unemployment rate and number of jobs on the June to December period. June typically has the highest labor force participation and employment levels. These estimates were calculated using data that were not seasonally adjusted. The labor force generally rises in the summer months and falls during the winter (see Figure 2). At the same time, unemployment data that are not seasonally adjusted are also higher during the winter than the summer (see Figure 3). Jobs numbers are also higher in the summer than the winter (see Figure 4). Jobs are not a count of persons but rather jobs worked, so a person may be counted more than once if he or she holds two or more jobs.
|
|
In June 2008 the Wyoming labor force2 was 301,426 and the number of unemployed3 was 8,595. The unemployment rate was just 2.9%. As of June 2012, the labor force was 312,336, of which 17,334 were unemployed (see Table 2).
Assuming that the ratio (0.97) of persons employed from June 2008 to December 2008 is the same as the ratio of persons employed from June 2012 to December 2012, there would be 286,446 people employed in December 2012. If the same methodology is applied to the number of unemployed (a ratio of 1.35), there would be 23,324 unemployed individuals in December 2012. The sum of estimated employment and unemployment yields a labor force of 309,770 for December 2012 and an unemployment rate of 7.5% (see Figure 5). In order for the unemployment rate to get to 3.9%, the number of unemployed would have to drop to 12,081, compared to the estimated unemployment of 23,324. Subtracting the 12,081 (needed number of unemployed) from 23,324 (projected number of unemployed) leaves a difference of 11,243. The ratio used to adjust CES employment was 0.96, producing an estimated number of 287,553 jobs.
Keep in mind that multiple jobholding is a factor in employment. In 2011, the multiple jobholder rate for Wyoming was 7.5% of total employment (Campbell, 2012). Therefore, approximately an additional eight jobs need to be added for every 100 jobs that are created to get back to the 2008 unemployment rate. This assumes that the rate of multiple jobholders will remain the same. This means Wyoming would have to add an additional 843 (11,243*7.5%) jobs for a total of 12,086 (11,243+843). This is the number of jobs as defined by CES that would need to be created to achieve the same unemployment rate in December 2012 as in December 2008. Therefore, Wyoming would have to add an average of 2,014 jobs per month for the rest of 2012 for a total of 299,640 jobs (287,553+12,086).
Conclusion
According to the CES, Wyoming had 277,400 jobs in January 2012. By June 2012 the number of jobs rose to 298,200, or an increase of 20,800 jobs (7.5%). As a general rule, the number of jobs declines in the second half of the year as seasonal jobs in tourism and construction come to an end. Therefore, it is unlikely that Wyoming's unemployment rate will return to 2008 levels this year.
Keep in mind that labor markets are dynamic. The labor force decreases as people exit the labor market to return to school in the fall or return to other activities. The number of unemployed rises after September as seasonal construction and tourism firms begin to lay off employees. However, the labor force may increase if people who dropped out of the labor market return to the labor force if they gain more confidence that they will be able to find a job if economic conditions improve.
References
Abraham, K. G., Haltiwanger, J., Sandusky, K., & Spletzer, J. (2009). Exploring Differences in Employment between Household and Establishment Data. Washington, DC: Center for Economic Studies.
Campbell, J. (2010, July). Multiple jobholding in states in 2009. Monthly Labor Review 133(7). Accessed September 4, 2012, from http://www.bls.gov/opub/mlr/2010/07/art4full.pdf
Campbell, J. (2011, September). Multiple jobholding in states in 2010. Monthly Labor Review 134(9). Accessed September 4, 2012, from http://www.bls.gov/opub/mlr/2011/09/art3full.pdf
Campbell, J. (2012, May). Multiple jobholding in states in 2011. Monthly Labor Review 135(5). Accessed September 4, 2012, from http://www.bls.gov/opub/mlr/2012/05/art4full.pdf
Economics Help. (n.d.). Economic Booms. Accessed September 4, 2012, from http://www.economicshelp.org/dictionary/b/booms.html
1Not seasonally adjusted data means the effects of regular or seasonal patterns have not been removed.
2The labor force is the sum of all employed and unemployed individuals.
3Individuals who are actively looking for work are considered unemployed. Individuals are not counted as unemployed if they are no longer seeking employment.