Wyoming County Unemployment Rates
by: David Bullard, Senior Economist
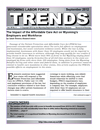
Lincoln County posted the highest unemployment rate (7.2%) in July 2012.
|
Labor Force
|
Employed
|
Unemployed
|
Unemployment Rates
|
|
Jul
2012
(p)
|
Jun
2012
(r)
|
Jul
2011
(b)
|
Jul
2012
(p)
|
Jun
2012
(r)
|
Jul
2011
(b)
|
Jul
2012
(p)
|
Jun
2012
(r)
|
Jul
2011
(b)
|
Jul
2012
(p)
|
Jun
2012
(r)
|
Jul
2011
(b)
|
|
NORTHWEST
|
49,144
|
49,267
|
49,300
|
46,178
|
46,272
|
46,471
|
2,966
|
2,995
|
2,829
|
6.0
|
6.1
|
5.7
|
|
Big Horn
|
5,216
|
5,344
|
5,370
|
4,867
|
4,998
|
5,031
|
349
|
346
|
339
|
6.7
|
6.5
|
6.3
|
|
Fremont
|
19,758
|
19,840
|
19,434
|
18,371
|
18,475
|
18,114
|
1,387
|
1,365
|
1,320
|
7.0
|
6.9
|
6.8
|
|
Hot Springs
|
2,613
|
2,682
|
2,678
|
2,500
|
2,555
|
2,545
|
113
|
127
|
133
|
4.3
|
4.7
|
5.0
|
|
Park
|
17,215
|
17,053
|
17,302
|
16,334
|
16,138
|
16,514
|
881
|
915
|
788
|
5.1
|
5.4
|
4.6
|
|
Washakie
|
4,342
|
4,348
|
4,516
|
4,106
|
4,106
|
4,267
|
236
|
242
|
249
|
5.4
|
5.6
|
5.5
|
|
NORTHEAST
|
55,457
|
56,843
|
54,415
|
52,630
|
53,837
|
51,556
|
2,827
|
3,006
|
2,859
|
5.1
|
5.3
|
5.3
|
|
Campbell
|
28,217
|
28,986
|
27,110
|
26,990
|
27,645
|
25,891
|
1,227
|
1,341
|
1,219
|
4.3
|
4.6
|
4.5
|
|
Crook
|
3,645
|
3,750
|
3,597
|
3,465
|
3,555
|
3,413
|
180
|
195
|
184
|
4.9
|
5.2
|
5.1
|
|
Johnson
|
4,113
|
4,207
|
4,131
|
3,881
|
3,955
|
3,873
|
232
|
252
|
258
|
5.6
|
6.0
|
6.2
|
|
Sheridan
|
16,280
|
16,654
|
16,399
|
15,263
|
15,619
|
15,377
|
1,017
|
1,035
|
1,022
|
6.2
|
6.2
|
6.2
|
|
Weston
|
3,202
|
3,246
|
3,178
|
3,031
|
3,063
|
3,002
|
171
|
183
|
176
|
5.3
|
5.6
|
5.5
|
|
SOUTHWEST
|
68,749
|
68,390
|
68,495
|
65,441
|
64,843
|
65,022
|
3,308
|
3,547
|
3,473
|
4.8
|
5.2
|
5.1
|
|
Lincoln
|
8,432
|
8,568
|
8,538
|
7,825
|
7,957
|
7,926
|
607
|
611
|
612
|
7.2
|
7.1
|
7.2
|
|
Sublette
|
7,843
|
7,735
|
8,018
|
7,559
|
7,436
|
7,765
|
284
|
299
|
253
|
3.6
|
3.9
|
3.2
|
|
Sweetwater
|
25,244
|
25,607
|
25,222
|
24,068
|
24,355
|
23,994
|
1,176
|
1,252
|
1,228
|
4.7
|
4.9
|
4.9
|
|
Teton
|
15,711
|
15,001
|
15,785
|
15,062
|
14,229
|
15,022
|
649
|
772
|
763
|
4.1
|
5.1
|
4.8
|
|
Uinta
|
11,519
|
11,479
|
10,932
|
10,927
|
10,866
|
10,315
|
592
|
613
|
617
|
5.1
|
5.3
|
5.6
|
|
SOUTHEAST
|
76,842
|
77,599
|
76,586
|
72,409
|
72,940
|
72,109
|
4,433
|
4,659
|
4,477
|
5.8
|
6.0
|
5.8
|
|
Albany
|
18,990
|
19,354
|
19,001
|
18,059
|
18,319
|
18,124
|
931
|
1,035
|
877
|
4.9
|
5.3
|
4.6
|
|
Goshen
|
6,383
|
6,536
|
6,407
|
6,002
|
6,138
|
6,027
|
381
|
398
|
380
|
6.0
|
6.1
|
5.9
|
|
Laramie
|
45,947
|
45,974
|
45,641
|
43,132
|
43,071
|
42,729
|
2,815
|
2,903
|
2,912
|
6.1
|
6.3
|
6.4
|
|
Niobrara
|
1,315
|
1,353
|
1,339
|
1,254
|
1,288
|
1,278
|
61
|
65
|
61
|
4.6
|
4.8
|
4.6
|
|
Platte
|
4,207
|
4,382
|
4,198
|
3,962
|
4,124
|
3,951
|
245
|
258
|
247
|
5.8
|
5.9
|
5.9
|
|
CENTRAL
|
60,011
|
60,232
|
58,878
|
57,050
|
57,102
|
55,649
|
2,961
|
3,130
|
3,229
|
4.9
|
5.2
|
5.5
|
|
Carbon
|
8,098
|
8,304
|
7,924
|
7,657
|
7,830
|
7,459
|
441
|
474
|
465
|
5.4
|
5.7
|
5.9
|
|
Converse
|
8,059
|
8,127
|
7,660
|
7,715
|
7,750
|
7,300
|
344
|
377
|
360
|
4.3
|
4.6
|
4.7
|
|
Natrona
|
43,854
|
43,801
|
43,294
|
41,678
|
41,522
|
40,890
|
2,176
|
2,279
|
2,404
|
5.0
|
5.2
|
5.6
|
|
STATEWIDE
|
310,205
|
312,329
|
307,675
|
293,709
|
294,994
|
290,807
|
16,496
|
17,335
|
16,868
|
5.3
|
5.6
|
5.5
|
|
|
|
Statewide Seasonally Adjusted
|
5.6
|
5.4
|
6.0
|
|
U.S.
|
8.6
|
8.4
|
9.3
|
|
U.S. Seasonally Adjusted
|
8.3
|
8.2
|
9.1
|
|
|
|
Prepared in cooperation with the Bureau of Labor Statistics. Benchmarked 02/2012. Run Date 08/2012.
|
|
Data are not seasonally adjusted except where otherwise specified.
|
|
(p) Preliminary. (r) Revised. (b) Benchmarked.
|
Last modified
by Phil Ellsworth.
