
2008 CFOI Fatality Rates: Accuracy vs. Timeliness
The Research & Planning (R&P) section of the Wyoming Department of Workforce Services released fatality counts for 2011 from the Census of Fatal Occupational Injuries (CFOI) in September 2012. However, many members of the public are more interested in fatality rates in order to rank states, and not in the actual fatality counts.
|
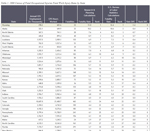
Fatality rates for 2011 will not be available from the U.S. Bureau of Labor Statistics (BLS) for some time. In the past, as much as two years has elapsed between the count release and the state rankings on workplace death. For example, on Sept. 10, 2010, the BLS released the 2008 fatality rates by state, almost two years after the end of the reference period (see Table 1). The release of this data was delayed while the BLS obtained data on employment and hours worked from the U.S. Census Bureau. These numbers are needed to develop the denominator to calculate the fatality rate.
During this time, R&P received several inquiries on Wyoming's fatality rate and it compared to fatality rates from other states. In order to better accommodate customers and meet their requests, R&P calculated fatality rates using data available from the Current Employment Statistics (CES) and the Current Population Statistics (CPS) programs. The CES produces employment numbers for each state and the CPS publishes average hours worked for the nation.
The purpose of this project was to see how closely R&P's fatality rates by state resembled those published by the BLS, and if the ranks by state were equivalent, even if the rates were slightly off.
Methodology
For the reference years 1992 through 2007, the BLS published CFOI fatal injury rates on an employment basis (U.S. BLS, 2010). The risk of fatal injury was measured regardless of hours worked. In 2008, the BLS changed the denominator to average hours worked for all employees rather than employment alone. This is more accurate measurement because it takes into consideration exposure to potential life-threatening hazards. In addition to reference year 2008, the BLS also recalculated fatality rates for 2007 to the hours-based rate. Since the denominator is substantially different from the prior method, hours-based state fatality rates should not be compared to the employment-based rates from prior years (U.S. BLS, 2010).
For both the employment-based model and the hours-based model, the BLS obtained data from the CPS. The scope of the CPS differs from CFOI in both models. For example, the CPS does not count workers under the age of 16, military workers and volunteers, whereas these are included in CFOI counts. Because of this, the BLS adjusted CFOI fatal injury counts used in calculating rates to maintain consistency between the numerator (number of fatal injuries) and the denominator (annual average employment and/or average hours worked). Workers under the age of 16 were previously excluded from the employment-based model. They are also excluded from the hours-based model, along with military and volunteers, since reliable hours-worked data cannot be obtained.
Rates for all 50 states were calculated using CES and CPS data because CPS data is not available by state; these calculations were not adjusted for workers under the age of 16. Military and volunteers are not included in the CES numbers. Nationwide CPS data were used for average hours worked. R&P then multiplied the average hours worked per week by 52 weeks to annualize the data and multiplied that by the annual average CES employment for each state. To calculate the fatality rate, R&P divided the hours worked for each state by the number of fatalities in each state and multiplied that number by 200,000,000 (base for 100,000 equivalent full-time workers working 40 hours per week, 50 weeks per year). Fatality rates are calculated per 100,000 full-time workers. This is the same method used by the BLS to calculated hours-based rates (Northwood, 2010).
Results
R&P's method for calculating the 2008 fatality rates resulted in some differences from the fatality rates calculated by the BLS. The differences in the fatality rates ranged from 0.0 to 1.8. There was no difference in 14 states, 12 states had a difference of .1, and 10 states had a difference of .2 in their fatality rate. Two states had differences of more than 1.0.
Ranking the states by fatalities resulted in similar results. Fifteen states had no difference in their ranking, 17 states were off by one, and 12 were off by two ranks. Seven states were off by more than two, with one state being an extreme outlier that was off by 13 ranks.
It is not recommended to compare fatality rates between states due to the different mix of industries in each state. Some states have a higher percentage of employment in industries that traditionally have higher fatality rates, such as mining and agriculture. Other states have a larger share of their employment in less hazardous industries, such as trade or finance. Some states also have a high volume of interstate traffic, and worker fatalities are counted in the state where they were injured, not where their hours were worked or employment was counted. This can lead to some distortion in rates, especially in smaller states that have a large volume of truck traffic.
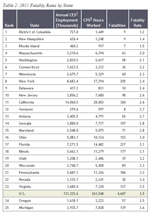 |
Overall, the results of R&P's calculations are satisfactory and can be useful as an approximation until the official numbers are released by the BLS. R&P's calculations for fatality rates by state in 2011 are presented in Table 2.
References
Northwood, J. (2010, January 29). Retrieved October 6, 2010, from http://www.bls.gov/opub/cwc/sh20100121ar01p1.htm
U.S. Bureau of Labor Statistics. (2010, March 5). Retrieved October 4, 2010, from http://www.bls.gov/iif/oshnotice10.htm
| State |
Annual CES Employment (in Thousands) |
CPS Hours Worked | Fatalities |
Research & Planning Calculations |
U.S. Bureau of Labor Statistics Calculations |
Rate Diff. | Rank Diff. | ||
|---|---|---|---|---|---|---|---|---|---|
| Fatality Rate | Rank |
Fatality Rate |
Rank | ||||||
| Wyoming | 298.2 | 601.6 | 33 | 11.0 | 1 | 12.4 | 1 | -1.4 | 0 |
| Alaska | 322.1 | 649.9 | 33 | 10.2 | 2 | 10.6 | 2 | -0.4 | 0 |
| North Dakota | 367.3 | 741.1 | 28 | 7.6 | 4 | 8.3 | 3 | -0.7 | 1 |
| Montana | 445.8 | 899.4 | 40 | 8.9 | 3 | 8.2 | 4 | 0.7 | -1 |
| Louisiana | 1,937.5 | 3,909.1 | 135 | 6.9 | 7 | 7.3 | 5 | -0.4 | 2 |
| West Virginia | 762.0 | 1,537.4 | 53 | 6.9 | 7 | 7.2 | 6 | -0.3 | 1 |
| South Dakota | 411.4 | 830.0 | 30 | 7.2 | 5 | 6.9 | 7 | 0.3 | -2 |
| Arkansas | 1,202.5 | 2,426.2 | 85 | 7.0 | 6 | 6.8 | 8 | 0.2 | -2 |
| Oklahoma | 1,592.7 | 3,213.4 | 102 | 6.3 | 10 | 6.4 | 9 | -0.1 | 1 |
| Mississippi | 1,147.5 | 2,315.2 | 80 | 6.9 | 7 | 6.3 | 10 | 0.6 | -3 |
| Iowa | 1,524.4 | 3,075.6 | 93 | 6.0 | 11 | 5.9 | 11 | 0.1 | 0 |
| Kentucky | 1,851.7 | 3,736.0 | 106 | 5.7 | 12 | 5.9 | 11 | -0.2 | 1 |
| Nebraska | 965.0 | 1,947.0 | 53 | 5.4 | 14 | 5.7 | 13 | -0.3 | 1 |
| Missouri | 2,789.1 | 5,627.3 | 148 | 5.3 | 15 | 5.4 | 14 | -0.1 | 1 |
| Alabama | 1,992.1 | 4,019.3 | 107 | 5.3 | 15 | 5.3 | 15 | 0.0 | 0 |
| Kansas | 1,390.6 | 2,805.7 | 73 | 5.2 | 17 | 5.3 | 15 | -0.1 | 2 |
| Idaho | 648.8 | 1,309.0 | 36 | 5.5 | 13 | 5.1 | 17 | 0.4 | -4 |
| Tennessee | 2,774.8 | 5,598.4 | 135 | 4.8 | 19 | 5.1 | 17 | -0.3 | 2 |
| Utah | 1,252.5 | 2,527.0 | 64 | 5.1 | 18 | 5.1 | 17 | 0.0 | 1 |
| Indiana | 2,956.7 | 5,965.4 | 143 | 4.8 | 19 | 5.0 | 20 | -0.2 | -1 |
| South Carolina | 1,926.3 | 3,886.5 | 87 | 4.5 | 21 | 4.5 | 21 | 0.0 | 0 |
| Texas | 10,607.0 | 21,400.7 | 463 | 4.3 | 24 | 4.4 | 22 | -0.1 | 2 |
| Colorado | 2,350.3 | 4,742.0 | 105 | 4.4 | 22 | 4.2 | 23 | 0.2 | -1 |
| Georgia | 4,102.2 | 8,276.6 | 182 | 4.4 | 22 | 4.2 | 23 | 0.2 | -1 |
| Pennsylvania | 5,799.4 | 11,700.9 | 241 | 4.1 | 25 | 4.1 | 25 | 0.0 | 0 |
| Virginia | 3,762.9 | 7,592.0 | 156 | 4.1 | 25 | 4.1 | 25 | 0.0 | 0 |
| Maine | 617.2 | 1,245.3 | 24 | 3.9 | 27 | 3.9 | 27 | 0.0 | 0 |
| North Carolina | 4,135.1 | 8,343.0 | 161 | 3.9 | 27 | 3.9 | 27 | 0.0 | 0 |
| Florida | 7,735.7 | 15,607.5 | 291 | 3.7 | 30 | 3.5 | 29 | 0.2 | 1 |
| New Mexico | 846.8 | 1,708.5 | 31 | 3.6 | 31 | 3.5 | 29 | 0.1 | 2 |
| Arizona | 2,616.3 | 5,278.6 | 100 | 3.8 | 29 | 3.4 | 31 | 0.4 | -2 |
| Illinois | 5,949.7 | 12,004.1 | 193 | 3.2 | 32 | 3.3 | 32 | -0.1 | 0 |
| Nevada | 1,263.6 | 2,549.4 | 41 | 3.2 | 32 | 3.3 | 32 | -0.1 | 0 |
| Ohio | 5,362.4 | 10,819.2 | 168 | 3.1 | 36 | 3.2 | 34 | -0.1 | 2 |
| Vermont | 307.2 | 619.8 | 10 | 3.2 | 32 | 3.2 | 34 | 0.0 | -2 |
| District of Columbia | 703.9 | 1,420.2 | 9 | 1.3 | 49 | 3.1 | 36 | -1.8 | 13 |
| Oregon | 1,718.4 | 3,467.0 | 55 | 3.2 | 32 | 3.1 | 36 | 0.1 | -4 |
| California | 14,981.4 | 30,226.5 | 465 | 3.1 | 36 | 2.8 | 38 | 0.3 | -2 |
| Michigan | 4,161.7 | 8,396.6 | 123 | 2.9 | 39 | 2.8 | 38 | 0.1 | 1 |
| Wisconsin | 2,878.1 | 5,806.9 | 77 | 2.7 | 41 | 2.7 | 40 | 0.0 | 1 |
| Washington | 2,958.9 | 5,969.9 | 84 | 2.8 | 40 | 2.6 | 41 | 0.2 | -1 |
| Minnesota | 2,763.0 | 5,574.6 | 65 | 2.3 | 44 | 2.5 | 42 | -0.2 | 2 |
| Hawaii | 619.2 | 1,249.3 | 19 | 3.0 | 38 | 2.4 | 43 | 0.6 | -5 |
| New York | 8,792.8 | 17,740.4 | 213 | 2.4 | 43 | 2.4 | 43 | 0.0 | 0 |
| Delaware | 436.1 | 879.9 | 11 | 2.5 | 42 | 2.3 | 45 | 0.2 | -3 |
| New Jersey | 4,048.4 | 8,168.1 | 92 | 2.3 | 44 | 2.3 | 45 | 0.0 | -1 |
| Maryland | 2,600.0 | 5,245.8 | 60 | 2.3 | 44 | 2.2 | 47 | 0.1 | -3 |
| Massachusetts | 3,290.0 | 6,637.9 | 68 | 2.0 | 47 | 2.2 | 47 | -0.2 | 0 |
| Connecticut | 1,699.0 | 3,427.9 | 28 | 1.6 | 48 | 1.6 | 49 | 0.0 | -1 |
| Rhode Island | 481.9 | 972.3 | 6 | 1.2 | 50 | 1.2 | 50 | 0.0 | 0 |
| New Hampshire | 646.1 | 1,303.6 | 7 | 1.1 | 51 | 1.1 | 51 | 0.0 | 0 |
| Rank | State |
Annual CES1 Employment (Thousands) |
CPS2 Hours Worked |
Fatalities |
Fatality Rate |
|---|---|---|---|---|---|
| 1 | District of Columbia | 727.8 | 1,449 | 9 | 1.2 |
| 2 | New Hampshire | 626.4 | 1,248 | 9 | 1.4 |
| 3 | Rhode Island | 460.2 | 917 | 7 | 1.5 |
| 4 | Massachusetts | 3,210.6 | 6,394 | 63 | 2.0 |
| 5 | Washington | 2,820.5 | 5,617 | 58 | 2.1 |
| 6 | Connecticut | 1,623.5 | 3,233 | 36 | 2.2 |
| 7 | Minnesota | 2,675.7 | 5,329 | 60 | 2.3 |
| 8 | New York | 8,683.4 | 17,294 | 205 | 2.4 |
| 9 | Delaware | 417.3 | 831 | 10 | 2.4 |
| 10 | New Jersey | 3,856.2 | 7,680 | 98 | 2.6 |
| 11 | California | 14,060.5 | 28,003 | 360 | 2.6 |
| 12 | Vermont | 299.6 | 597 | 8 | 2.7 |
| 13 | Arizona | 2,405.5 | 4,791 | 65 | 2.7 |
| 14 | Georgia | 3,880.0 | 7,727 | 107 | 2.8 |
| 15 | Maryland | 2,548.0 | 5,075 | 71 | 2.8 |
| 16 | Ohio | 5,083.1 | 10,124 | 153 | 3.0 |
| 17 | Florida | 7,271.5 | 14,482 | 227 | 3.1 |
| 18 | Illinois | 5,663.1 | 11,279 | 177 | 3.1 |
| 19 | Utah | 1,208.1 | 2,406 | 39 | 3.2 |
| 20 | Wisconsin | 2,740.7 | 5,458 | 89 | 3.3 |
| 21 | Pennsylvania | 5,687.1 | 11,326 | 186 | 3.3 |
| 22 | Nevada | 1,125.1 | 2,241 | 38 | 3.4 |
| 23 | Virginia | 3,680.4 | 7,330 | 127 | 3.5 |
| U.S. | 131,325.6 | 261,548 | 4,607 | 3.5 | |
| 24 | Oregon | 1,618.1 | 3,223 | 57 | 3.5 |
| 25 | Michigan | 3,935.7 | 7,838 | 139 | 3.6 |
| 26 | North Carolina | 3,922.4 | 7,812 | 148 | 3.8 |
| 27 | Colorado | 2,255.3 | 4,492 | 87 | 3.9 |
| 28 | Alabama | 1,866.5 | 3,717 | 74 | 4.0 |
| 29 | Texas | 10,557.3 | 21,026 | 433 | 4.1 |
| 30 | Nebraska | 944.0 | 1,880 | 39 | 4.2 |
| 31 | Indiana | 2,830.3 | 5,637 | 122 | 4.3 |
| 32 | Maine | 593.4 | 1,182 | 26 | 4.4 |
| 33 | Hawaii | 592.1 | 1,179 | 26 | 4.4 |
| 34 | South Carolina | 1,832.1 | 3,649 | 81 | 4.4 |
| 35 | Tennessee | 2,656.3 | 5,290 | 120 | 4.5 |
| 36 | Kentucky | 1,790.4 | 3,566 | 86 | 4.8 |
| 37 | Oklahoma | 1,550.3 | 3,088 | 77 | 5.0 |
| 38 | Missouri | 2,650.3 | 5,278 | 133 | 5.0 |
| 39 | West Virginia | 753.9 | 1,501 | 43 | 5.7 |
| 40 | Louisiana | 1,905.7 | 3,795 | 109 | 5.7 |
| 41 | Kansas | 1,335.9 | 2,661 | 77 | 5.8 |
| 42 | Mississippi | 1,090.0 | 2,171 | 63 | 5.8 |
| 43 | Idaho | 606.8 | 1,209 | 37 | 6.1 |
| 44 | Iowa | 1,477.8 | 2,943 | 93 | 6.3 |
| 45 | New Mexico | 804.1 | 1,601 | 51 | 6.4 |
| 46 | South Dakota | 406.2 | 809 | 31 | 7.7 |
| 47 | Arkansas | 1,160.0 | 2,310 | 93 | 8.1 |
| 48 | Wyoming | 285.7 | 569 | 29 | 10.2 |
| 49 | North Dakota | 394.2 | 785 | 44 | 11.2 |
| 50 | Montana | 427.7 | 852 | 49 | 11.5 |
| 51 | Alaska | 328.8 | 655 | 38 | 11.6 |
| 1Current Employment Statistics. | |||||
| 2Current Population Survey. | |||||