Wyoming Occupational Fatalities Decrease in 2011
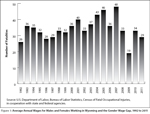
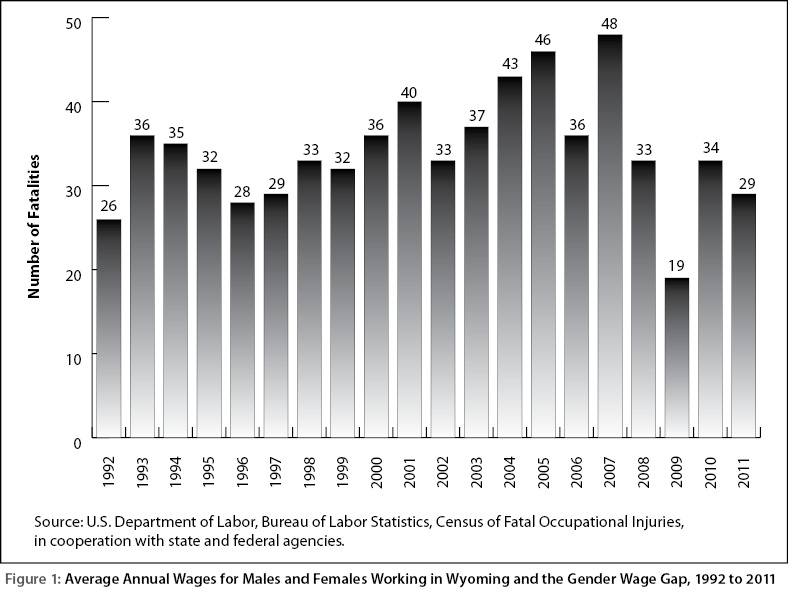
The Research & Planning section of the Wyoming Department of Workforce Services has reported that the number of occupational fatalities fell from 33 in 2010 to 29 in 2011, a decrease of four deaths (-12.1%). There were 34 occupational fatalities each year on average from 1992 to 2011, and 2011 marks the fourth consecutive year that workplace deaths have been lower than average (see Figure 1).
 |
 |
Variations in fatalities from year to year are to some extent the result of the random nature of work-related accidents. Additionally, there is not always a direct relationship between workplace fatalities and workplace safety. For example, suicides and homicides that occur in the workplace are included as occupational fatalities. In other cases, a sudden illness may be nearly coincidental with an accident that results in a workplace fatality. Occupational fatalities are counted in the state where the injury occurred, not necessarily the state of residence or the state of death.
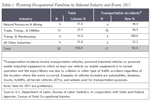
In 2011, the largest number of deaths occurred in trade, transportation, & utilities (11, or 37.9% of all deaths; see Table 1). There were nine deaths (31.0%) in natural resources & mining and nine deaths (31.0%) in all other industries. Nearly six out of 10 (58.6%) workplace fatalities were the result of transportation incidents.
 |
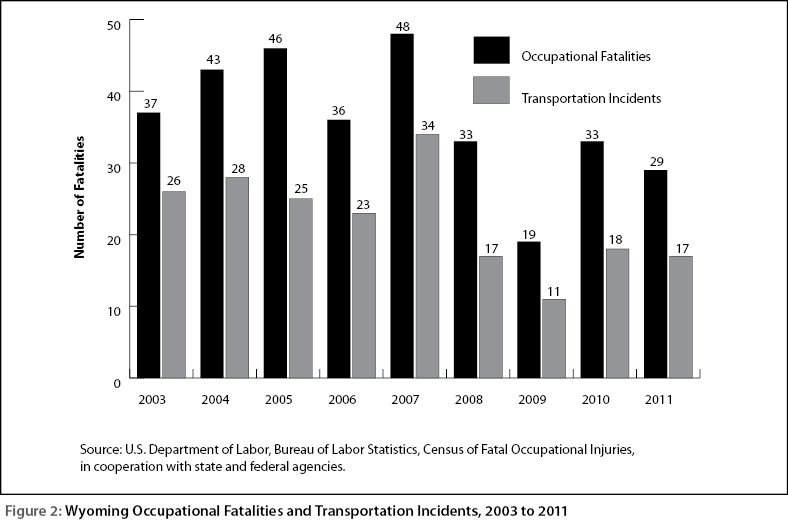
Each year from 2003 to 2011, transportation incidents made up more than half of all workplace deaths (see Figure 2). Transportation incidents include highway crashes as well as incidents involving aircraft and other vehicles.
| Industry | Total | Transportation Accidentsa | ||
|---|---|---|---|---|
| N | Column % | N | Row % | |
| Natural Resources & Mining | 9 | 31.0 | 4 | 44.4 |
| Trade, Transp., & Utilities | 11 | 37.9 | 10 | 90.9 |
| Transp. & Warehousing | 9 | 31.0 | 9 | 100.0 |
| All Other Industries | 9 | 31.0 | 3 | 33.3 |
| Total | 29 | 100.0 | 17 | 58.6 |
| aTransportation incidents involve transportation vehicles, powered industrial vehicles or powered mobile industrial equipment in which at least one vehicle (or mobile equipment) is in normal operation and the injury/illness was due to collision or other type of traffic accident regardless of the location where the event occurred. Examples of vehicles included are automobiles, airplanes, trucks, forklifts, all-terrain vehicles (ATVs), and animals used for transportation purposes. | ||||
| Note: Data for 2011 are preliminary. | ||||
| Source: U.S. Department of Labor, Bureau of Labor Statistics, in cooperation with State and Federal Agencies, Census of Fatal Occupational Injuries. | ||||