Economic Indicators
Total nonfarm employment in Wyoming rose from 295,800 in June 2011 to 298,300 in June 2012, a gain of 0.8%.
|
Jun |
May |
Jun |
Percent Change |
||||
|---|---|---|---|---|---|---|---|
|
2012 (p) |
2012 (r) |
2011 (b) |
Month |
Year |
|||
|
Wyoming Total Nonfarm Employment |
298,300 |
289,100 |
295,800 |
3.2 |
0.8 |
||
|
Wyoming State Government |
16,700 |
18,000 |
16,700 |
-7.2 |
0.0 |
||
|
Laramie County Nonfarm Employment |
46,300 |
45,700 |
44,900 |
1.3 |
3.1 |
||
|
Natrona County Nonfarm Employment |
42,000 |
41,200 |
40,200 |
1.9 |
4.5 |
||
|
Selected U.S. Employment Data |
|||||||
|
U.S. Multiple Jobholders |
6,707,000 |
7,174,000 |
6,861,000 |
-6.5 |
-2.2 |
||
|
As a percent of all workers |
4.7% |
5.0% |
4.9% |
N/A |
N/A |
||
|
U.S. Discouraged Workers |
821,000 |
830,000 |
982,000 |
-1.1 |
-16.4 |
||
|
U.S. Part Time for Economic Reasons |
8,394,000 |
7,837,000 |
8,738,000 |
7.1 |
-3.9 |
||
|
Wyoming Unemployment Insurance |
|||||||
|
Weeks Compensated |
15,519 |
21,845 |
24,187 |
-29.0 |
-35.8 |
||
|
Benefits Paid |
$5,319,736 |
$7,401,054 |
$7,826,502 |
-28.1 |
-32.0 |
||
|
Average Weekly Benefit Payment |
$342.79 |
$338.80 |
$323.58 |
1.2 |
5.9 |
||
|
State Insured Covered Jobs1 |
277,518 |
269,413 |
271,519 |
3.0 |
2.2 |
||
|
Insured Unemployment Rate |
2.1% |
2.5% |
2.1% |
N/A |
N/A |
||
|
Consumer Price Index (U) for All U.S. Urban Consumers |
|||||||
|
(1982 to 1984 = 100) |
|||||||
|
All Items |
229.5 |
229.8 |
225.7 |
-0.1 |
1.7 |
||
|
Food & Beverages |
233.5 |
233.3 |
227.5 |
0.1 |
2.7 |
||
|
Housing |
223.1 |
222.0 |
219.6 |
0.5 |
1.6 |
||
|
Apparel |
125.2 |
127.7 |
120.6 |
-1.9 |
3.9 |
||
|
Transportation |
216.4 |
220.8 |
216.9 |
-2.0 |
-0.2 |
||
|
Medical Care |
415.3 |
413.7 |
399.6 |
0.4 |
4.0 |
||
|
Recreation (Dec. 1997=100) |
115.1 |
114.7 |
113.7 |
0.3 |
1.3 |
||
|
Education & Communication (Dec. 1997=100) |
133.5 |
133.5 |
130.6 |
0.0 |
2.2 |
||
|
Other Goods & Services |
394.0 |
392.9 |
386.2 |
0.3 |
2.0 |
||
|
Producer Prices (1982 to 1984 = 100) |
|||||||
|
All Commodities |
200.4 |
202.3 |
203.9 |
-0.9 |
-1.7 |
||
|
Wyo. Bldg. Permits (New Privately Owned Housing Units Authorized) |
|||||||
|
Total Units |
159 |
184 |
288 |
-13.6 |
-44.8 |
||
|
Valuation |
$41,531,000 |
$54,355,000 |
$47,570,000 |
-23.6 |
-12.7 |
||
|
Single Family Homes |
147 |
170 |
164 |
-13.5 |
-10.4 |
||
|
Valuation |
$40,278,000 |
$52,945,000 |
$38,162,000 |
-23.9 |
5.5 |
||
|
Casper MSA2 Building Permits |
26 |
41 |
97 |
-36.6 |
-73.2 |
||
|
Valuation |
$4,979,000 |
$7,994,000 |
$8,546,000 |
-37.7 |
-41.7 |
||
|
Cheyenne MSA Building Permits |
34 |
38 |
39 |
-10.5 |
-12.8 |
||
|
Valuation |
$6,953,000 |
$6,658,000 |
$6,863,000 |
4.4 |
1.3 |
||
|
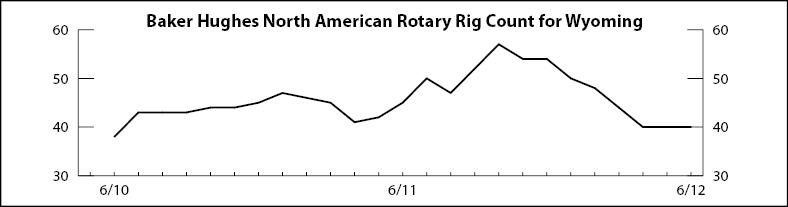
Baker Hughes North American Rotary Rig Count for Wyoming |
40 |
40 |
45 |
0.0 |
-11.1 |
||
|
|||||||
|
1Local Area Unemployment Statistics Program estimates. |
|||||||
|
2Metropolitan Statistical Area. |
|||||||
|
Note: Production worker hours and earnings data have been dropped from the Economic Indicators page because of problems with accuracy due to a small sample size and high item nonresponse. The Bureau of Labor Statistics will continue to publish these data online at http://www.bls.gov/eag/eag.wy.htm. |
|||||||