
Wyoming Normalizeda Unemployment Insurance Statistics: Continued Claims
Continued weeks claimed declined by 25.0% compared to this time last year. May's continued claims total of 28,720 was 60.1% greater than the top of the historic range from 1997 to 2008.
| Continued Weeks Claimed | Percent Change | Difference | ||||
|---|---|---|---|---|---|---|
| May 11 | May 11 | May 11 | ||||
| May 11 | Apr 11 | May 10 | Apr 11 | May 10 | May 10 | |
| Wyoming Statewide | ||||||
| Total Continued Weeks Claimed | 28,720 | 32,734 | 38,272 | -12.3 | -25.0 | -9,552 |
| Extended Benefit Weeks Claimed | 16,678 | 17,773 | 25,637 | -6.2 | -34.9 | -8,959 |
| Total Unique Claimantsb | 8,507 | 10,035 | 11,202 | -15.2 | -24.1 | -2,695 |
| Benefit Exhaustions | 877 | 1,138 | 1,212 | -22.9 | -27.6 | -335 |
| Benefit Exhaustion Rates | 10.3% | 11.3% | 10.8% | -1.0% | -0.5% | |
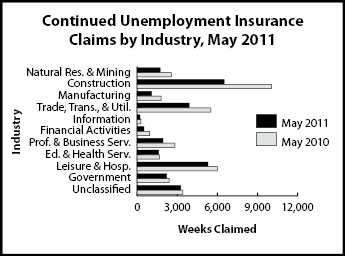
| Goods-Producing | 9,274 | 11,847 | 14,390 | -21.7 | -35.6 | -5,116 |
| Natural Resources & Mining | 1,710 | 1,825 | 2,555 | -6.3 | -33.1 | -845 |
| Mining | 1,524 | 1,618 | 2,297 | -5.8 | -33.7 | -773 |
| Oil & Gas Extraction | 115 | 118 | 150 | -2.5 | -23.3 | -35 |
| Construction | 6,506 | 8,678 | 10,040 | -25.0 | -35.2 | -3,534 |
| Manufacturing | 1,058 | 1,344 | 1,795 | -21.3 | -41.1 | -737 |
| Service-Providing | 13,995 | 14,966 | 18,084 | -6.5 | -22.6 | -4,089 |
| Trade, Transp., & Utilities | 3,885 | 4,261 | 5,508 | -8.8 | -29.5 | -1,623 |
| Wholesale Trade | 503 | 539 | 877 | -6.7 | -42.6 | -374 |
| Retail Trade | 2,446 | 2,722 | 3,248 | -10.1 | -24.7 | -802 |
| Transp., Warehousing & Utilities | 936 | 1,000 | 1,383 | -6.4 | -32.3 | -447 |
| Information | 200 | 202 | 272 | -1.0 | -26.5 | -72 |
| Financial Activities | 492 | 541 | 927 | -9.1 | -46.9 | -435 |
| Prof. & Business Services | 1,911 | 2,360 | 2,808 | -19.0 | -31.9 | -897 |
| Educational & Health Services | 1,598 | 1,673 | 1,665 | -4.5 | -4.0 | -67 |
| Leisure & Hospitality | 5,287 | 5,327 | 5,990 | -0.8 | -11.7 | -703 |
| Other Services, except Public Admin. | 622 | 602 | 914 | 3.3 | -31.9 | -292 |
| Government | 2,201 | 2,729 | 2,391 | -19.3 | -7.9 | -190 |
| Federal Government | 791 | 1,262 | 709 | -37.3 | 11.6 | 82 |
| State Government | 254 | 258 | 306 | -1.6 | -17.0 | -52 |
| Local Government | 1,156 | 1,209 | 1,376 | -4.4 | -16.0 | -220 |
| Local Education | 211 | 213 | 253 | -0.9 | -16.6 | -42 |
| Unclassified | 3,250 | 3,192 | 3,407 | 1.8 | -4.6 | -157 |
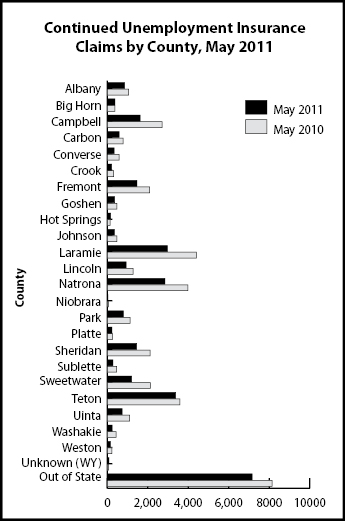
| Laramie County | ||||||
| Total Continued Weeks Claimed | 2,962 | 3,551 | 4,398 | -16.6 | -32.7 | -1,436 |
| Total Unique Claimants | 861 | 1,065 | 1,313 | -19.2 | -34.4 | -452 |
| Goods-Producing | 860 | 1,228 | 1,515 | -30.0 | -43.2 | -655 |
| Construction | 739 | 1,049 | 1,268 | -29.6 | -41.7 | -529 |
| Service-Providing | 1,631 | 1,824 | 2,308 | -10.6 | -29.3 | -677 |
| Trade, Transp., & Utilities | 515 | 599 | 894 | -14.0 | -42.4 | -379 |
| Financial Activities | 95 | 101 | 220 | -5.9 | -56.8 | -125 |
| Prof. & Business Services | 262 | 363 | 406 | -27.8 | -35.5 | -144 |
| Educational & Health Services | 403 | 415 | 290 | -2.9 | 39.0 | 113 |
| Leisure & Hospitality | 224 | 247 | 301 | -9.3 | -25.6 | -77 |
| Government | 352 | 402 | 475 | -12.4 | -25.9 | -123 |
| Unclassified | 119 | 97 | 100 | 22.7 | 19.0 | 19 |
| Natrona County | ||||||
| Total Continued Weeks Claimed | 2,845 | 3,169 | 3,975 | -10.2 | -28.4 | -1,130 |
| Total Unique Claimants | 841 | 928 | 1,191 | -9.4 | -29.4 | -350 |
| Goods-Producing | 825 | 987 | 1,479 | -16.4 | -44.2 | -654 |
| Construction | 523 | 678 | 953 | -22.9 | -45.1 | -430 |
| Service-Providing | 1,826 | 1,968 | 2,244 | -7.2 | -18.6 | -418 |
| Trade, Transp., & Utilities | 641 | 726 | 811 | -11.7 | -21.0 | -170 |
| Financial Activities | 63 | 65 | 152 | -3.1 | -58.6 | -89 |
| Prof. & Business Services | 340 | 350 | 386 | -2.9 | -11.9 | -46 |
| Educational & Health Services | 288 | 305 | 377 | -5.6 | -23.6 | -89 |
| Leisure & Hospitality | 296 | 323 | 308 | -8.4 | -3.9 | -12 |
| Government | 121 | 137 | 166 | -11.7 | -27.1 | -45 |
| Unclassified | 73 | 77 | 86 | -5.2 | -15.1 | -13 |
| ||||||
aAn average month is considered 4.33 weeks. If a month has four weeks, the normalization factor is 1.0825. If the month has five weeks, the normalization factor is 0.866. The number of raw claims is multiplied by the normalization factor to achieve the normalized claims counts.
bDoes not include claimants receiving extended benefits.