Wyoming Normalizeda Unemployment Insurance Statistics: Initial Claims
by: Douglas W. Leonard, Senior Economist
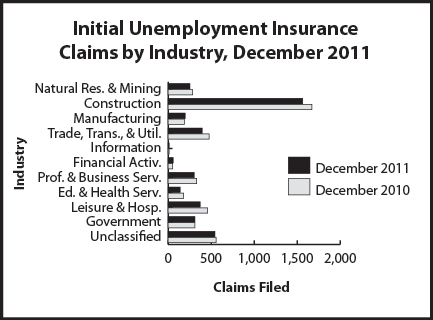
Initial claims declined by 8.5% compared to December 2010. Claims were lower across all industries with the exceptions of manufacturing, financial activities, federal government and local government.
| Initial Claims |
|
Claims Filed |
Percent Change Claims Filed |
| Dec 11 |
Dec 11 |
|
Dec 11 |
Nov 11 |
Dec 10 |
Nov 11 |
Dec 10 |
| Wyoming Statewide |
| TOTAL CLAIMS FILED |
4,193 |
4,359 |
4,585 |
-3.8 |
-8.5 |
| TOTAL GOODS-PRODUCING |
2,013 |
1,519 |
2,145 |
32.5 |
-6.2 |
| Natural Res. & Mining |
253 |
200 |
285 |
26.5 |
-11.2 |
| Mining |
231 |
157 |
252 |
47.1 |
-8.3 |
| Oil & Gas Extraction |
9 |
10 |
17 |
-10.0 |
-47.1 |
| Construction |
1,564 |
1,206 |
1,671 |
29.7 |
-6.4 |
| Manufacturing |
196 |
113 |
189 |
73.5 |
3.7 |
| TOTAL SERVICE-PROVIDING |
1,324 |
1,830 |
1,573 |
-27.7 |
-15.8 |
| Trade, Transp., & Utilities |
395 |
412 |
476 |
-4.1 |
-17.0 |
| Wholesale Trade |
42 |
74 |
68 |
-43.2 |
-38.2 |
| Retail Trade |
204 |
231 |
239 |
-11.7 |
-14.6 |
| Transp., Warehousing & Utilities |
149 |
107 |
169 |
39.3 |
-11.8 |
| Information |
11 |
12 |
11 |
-8.3 |
0.0 |
| Financial Activities |
57 |
65 |
53 |
-12.3 |
7.5 |
| Prof. and Business Svcs. |
302 |
353 |
330 |
-14.4 |
-8.5 |
| Educational & Health Svcs. |
138 |
135 |
179 |
2.2 |
-22.9 |
| Leisure & Hospitality |
373 |
772 |
458 |
-51.7 |
-18.6 |
| Other Svcs., exc. Public Admin. |
48 |
81 |
66 |
-40.7 |
-27.3 |
| TOTAL GOVERNMENT |
312 |
425 |
310 |
-26.6 |
0.6 |
| Federal Government |
187 |
254 |
185 |
-26.4 |
1.1 |
| State Government |
22 |
35 |
23 |
-37.1 |
-4.3 |
| Local Government |
103 |
136 |
102 |
-24.3 |
1.0 |
| Local Education |
29 |
33 |
23 |
-12.1 |
26.1 |
| UNCLASSIFIED |
544 |
585 |
557 |
-7.0 |
-2.3 |
| Laramie County |
| TOTAL CLAIMS FILED |
702 |
540 |
661 |
30.0 |
6.2 |
| TOTAL GOODS-PRODUCING |
409 |
245 |
314 |
66.9 |
30.3 |
| Construction |
302 |
230 |
267 |
31.3 |
13.1 |
| TOTAL SERVICE-PROVIDING |
235 |
237 |
282 |
-0.8 |
-16.7 |
| Trade, Transp., & Utilities |
107 |
77 |
111 |
39.0 |
-3.6 |
| Financial Activities |
10 |
14 |
14 |
-28.6 |
-28.6 |
| Prof. & Business Svcs. |
58 |
71 |
64 |
-18.3 |
-9.4 |
| Educational & Health Svcs. |
14 |
29 |
39 |
-51.7 |
-64.1 |
| Leisure & Hospitality |
41 |
32 |
44 |
28.1 |
-6.8 |
| TOTAL GOVERNMENT |
40 |
32 |
43 |
25.0 |
-7.0 |
| UNCLASSIFIED |
18 |
26 |
22 |
-30.8 |
-18.2 |
| Natrona County |
| TOTAL CLAIMS FILED |
446 |
411 |
534 |
8.5 |
-16.5 |
| TOTAL GOODS-PRODUCING |
246 |
192 |
289 |
28.1 |
-14.9 |
| Construction |
207 |
162 |
210 |
27.8 |
-1.4 |
| TOTAL SERVICE-PROVIDING |
175 |
190 |
209 |
-7.9 |
-16.3 |
| Trade, Transp., & Utilities |
52 |
54 |
85 |
-3.7 |
-38.8 |
| Financial Activities |
7 |
8 |
5 |
-12.5 |
40.0 |
| Prof. & Business Svcs. |
35 |
49 |
40 |
-28.6 |
-12.5 |
| Educational & Health Svcs. |
27 |
29 |
24 |
-6.9 |
12.5 |
| Leisure & Hospitality |
43 |
34 |
40 |
26.5 |
7.5 |
| TOTAL GOVERNMENT |
15 |
19 |
24 |
-21.1 |
-37.5 |
| UNCLASSIFIED |
10 |
10 |
12 |
0.0 |
-16.7 |
| aAn average month is considered 4.33 weeks. If a month has four weeks, the normalization factor is 1.0825. If the month has five weeks, the normalization factor is 0.866. The number of raw claims is multiplied by the normalization factor to achieve the normalized claims counts. |
|
|
Last modified
by Phil Ellsworth.
