
Wyoming Benefits Survey 2011
(Tables and Figures)
See Related Article
Figures 1, 2, 3, 4, 5, 6, 7, 8
| Number of Employees Per Company | ||||||
|---|---|---|---|---|---|---|
| 1-4 | 5-9 | 10-19 | 20-49 | 50+ | Total | |
| Full-Time Jobs | ||||||
| Total Jobsa | -18,216 | |||||
| Benefit Type | ||||||
| Child Care | 3 | -410 | -105 | 9 | -17,578 | -18,080 |
| Dental Plan | -220 | 1,526 | 444 | -2,747 | -11,453 | -12,451 |
| Dependent Health Ins. | -428 | 1,188 | -777 | -4,293 | -10,181 | -14,490 |
| Educational/Tuition Assist. | -808 | -186 | 837 | -1,703 | -6,335 | -8,195 |
| Flexible Spending Account | 12 | 691 | 1,177 | -1,164 | -13,551 | -12,835 |
| Health Insurance | -239 | 1,067 | -603 | -4,221 | -10,788 | -14,785 |
| Hiring Bonus | -108 | -262 | -394 | -2,524 | -2,100 | -5,388 |
| Life Insurance | -547 | 693 | 1,219 | -4,290 | -12,369 | -15,293 |
| Long-Term Disability | -78 | 506 | 145 | -824 | -11,604 | -11,855 |
| Operate in Shifts | -495 | -5 | 116 | -768 | 5,524 | 4,371 |
| Shift Differentials | -160 | 166 | -51 | -493 | 5,160 | 4,621 |
| Paid Holidays | -127 | -506 | 527 | -3,591 | -5,826 | -9,522 |
| Paid Personal Leave | -466 | 412 | 552 | -805 | 70 | -237 |
| Paid Sick Leave | -29 | 443 | 1,202 | -1,598 | 2,023 | 2,040 |
| Paid Vacation | -387 | 532 | -491 | -4,804 | 6,515 | 1,366 |
| Retirement Plan | -742 | 11 | -60 | -6,287 | -12,162 | -19,240 |
| Short-Term Disability | -431 | 687 | -217 | -1,968 | -15,406 | -17,335 |
| Vision Plan | 1 | 685 | 793 | -1,096 | -1,579 | -1,197 |
| Number of Employees Per Company | ||||||
| 1-4 | 5-9 | 10-19 | 20-49 | 50+ | Total | |
| Part-Time Jobs | ||||||
| Total Jobsa | 2,948 | |||||
| Benefit Type | ||||||
| Child Care | 37 | 10 | -119 | 26 | -1,117 | -1,163 |
| Dental Plan | -28 | 187 | -53 | 30 | 1,633 | 1,769 |
| Dependent Health Ins. | 57 | 178 | 106 | 696 | 773 | 1,810 |
| Educational/Tuition Assist. | -8 | -37 | 171 | 426 | 44 | 596 |
| Flexible Spending Account | 0 | 69 | 365 | -181 | 1,445 | 1,698 |
| Health Insurance | 47 | -26 | -64 | 546 | 872 | 1,374 |
| Hiring Bonus | -18 | -63 | 39 | 163 | 749 | 869 |
| Life Insurance | -25 | 169 | -104 | -186 | 1,989 | 1,841 |
| Long-Term Disability | 9 | 122 | -31 | 253 | -104 | 249 |
| Operate in Shifts | -413 | -526 | -138 | 572 | 1,384 | 879 |
| Shift Differentials | -50 | -34 | -71 | 213 | 739 | 798 |
| Paid Holidays | 20 | -445 | -199 | 669 | 2,829 | 2,874 |
| Paid Personal Leave | -3 | 112 | -100 | -386 | -2,838 | -3,214 |
| Paid Sick Leave | -61 | -160 | -8 | 78 | 2,311 | 2,160 |
| Paid Vacation | -211 | -297 | -522 | 320 | 4,256 | 3,547 |
| Retirement Plan | -147 | 58 | -269 | -809 | -1,371 | -2,538 |
| Short-Term Disability | 48 | 66 | 20 | 390 | 901 | 1,426 |
| Vision Plan | 62 | 125 | 120 | 266 | 1,024 | 1,597 |
| Number of Employees Per Company | ||||||
| 1-4 | 5-9 | 10-19 | 20-49 | 50+ | Total | |
| Total of Full- & Part-Time Jobs | ||||||
| Total Jobsa | -15,268 | |||||
| Benefit Type | ||||||
| Child Care | 40 | -401 | -224 | 36 | -18,694 | -19,243 |
| Dental Plan | -248 | 1,712 | 391 | -2,717 | -9,820 | -10,682 |
| Dependent Health Ins. | -370 | 1,365 | -671 | -3,597 | -9,408 | -12,680 |
| Educational/Tuition Assist. | -817 | -223 | 1,008 | -1,277 | -6,291 | -7,600 |
| Flexible Spending Account | 11 | 760 | 1,542 | -1,345 | -12,106 | -11,138 |
| Health Insurance | -192 | 1,041 | -668 | -3,675 | -9,916 | -13,411 |
| Hiring Bonus | -126 | -325 | -355 | -2,361 | -1,351 | -4,519 |
| Life Insurance | -573 | 862 | 1,115 | -4,476 | -10,380 | -13,452 |
| Long-Term Disability | -69 | 627 | 114 | -570 | -11,708 | -11,606 |
| Operate in Shifts | -909 | -531 | -22 | -196 | 6,908 | 5,250 |
| Shift Differentials | -210 | 132 | -123 | -280 | 5,899 | 5,419 |
| Paid Holidays | -107 | -950 | 328 | -2,922 | -2,997 | -6,649 |
| Paid Personal Leave | -469 | 524 | 452 | -1,191 | -2,768 | -3,452 |
| Paid Sick Leave | -90 | 283 | 1,193 | -1,521 | 4,334 | 4,200 |
| Paid Vacation | -597 | 235 | -1,012 | -4,483 | 10,770 | 4,913 |
| Retirement Plan | -889 | 69 | -329 | -7,096 | -13,532 | -21,778 |
| Short-Term Disability | -383 | 753 | -197 | -1,577 | -14,505 | -15,910 |
| Vision Plan | 63 | 809 | 913 | -830 | -556 | 400 |
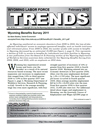
aThe difference in total jobs from 2008 to 2010 is calculated as total jobs for 2010 minus total jobs for 2008. The difference in total jobs is not the sum of differences for each benefit type. |
||||||
| Number of Employees Per Company | ||||||
|---|---|---|---|---|---|---|
| 1-4 | 5-9 | 1-19 | 20-49 | 50+ | Total | |
| Full-Time Jobs | ||||||
| Total Jobsa | -8.80% | |||||
| Benefit Type | ||||||
| Child Care | 1.5 | -66 | -12.8 | 0.5 | -67.6 | -60.8 |
| Dental Plan | -6.9 | 29.5 | 4.7 | -13.2 | -11.2 | -8.8 |
| Dependent Health Ins. | -10.4 | 19.5 | -6.3 | -18.2 | -9.1 | -9.2 |
| Educational/Tuition Assist. | -25.1 | -4 | 14.5 | -15.5 | -8.2 | -8.1 |
| Flexible Spending Account | 0.8 | 32.7 | 27.1 | -10.7 | -15.7 | -12.2 |
| Health Insurance | -4.7 | 13.2 | -4.3 | -16.6 | -9.5 | -8.9 |
| Hiring Bonus | -17.6 | -19.8 | -21.7 | -38.8 | -4.9 | -10.1 |
| Life Insurance | -17.6 | 13.5 | 13.9 | -19.8 | -11.3 | -10.3 |
| Long-Term Disability | -5.9 | 27.7 | 4.1 | -8.8 | -15.9 | -13.3 |
| Operate in Shifts | -53.8 | -0.3 | 3.8 | -9.7 | 9 | 5.8 |
| Shift Differentials | -48.2 | 39.3 | -6.8 | -20.1 | 13.6 | 11 |
| Paid Holidays | -1.7 | -4.5 | 3.7 | -15.5 | -5.8 | -6.1 |
| Paid Personal Leave | -13.4 | 9.1 | 8.9 | -7.1 | 0.1 | -0.3 |
| Paid Sick Leave | -0.8 | 10.5 | 19.1 | -13.6 | 3.2 | 2.3 |
| Paid Vacation | -5.5 | 5.2 | -3.3 | -20 | 7 | 0.9 |
| Retirement Plan | -16.1 | 0.1 | -0.5 | -26 | -10.6 | -11.7 |
| Short-Term Disability | -27.5 | 33.9 | -5.4 | -20.4 | -26.8 | -23.2 |
| Vision Plan | 0 | 24.4 | 14.8 | -7.9 | -1.9 | -1.1 |
| Number of Employees Per Company | ||||||
| 1-4 | 5-9 | 1-19 | 20-49 | 50+ | Total | |
| Part-Time Jobs | ||||||
| Total Jobsa | 4.50% | |||||
| Benefit Type | ||||||
| Child Care | 56.1 | 35.7 | -71.5 | 8.6 | -49.4 | -41.1 |
| Dental Plan | -51.6 | 197.8 | -19.9 | 3.4 | 34.7 | 29.4 |
| Dependent Health Ins. | 196.4 | 382.9 | 74.2 | 173.7 | 16.8 | 34.7 |
| Educational/Tuition Assist. | -1.5 | -5.4 | 20.2 | 48.3 | 0.4 | 4.6 |
| Flexible Spending Account | -0.5 | 69.1 | 461.3 | -24.8 | 18.9 | 19.7 |
| Health Insurance | 28.6 | -8.8 | -19.2 | 85.7 | 17.3 | 21.3 |
| Hiring Bonus | -100 | -99.7 | 37.9 | 51.2 | 29.4 | 28.5 |
| Life Insurance | -25.1 | 228 | -37.9 | -20.8 | 41.3 | 29.9 |
| Long-Term Disability | 41.7 | 384.3 | -39.7 | 186.8 | -2.9 | 6.4 |
| Operate in Shifts | -71.6 | -39.9 | -8.1 | 25.4 | 13.4 | 5.4 |
| Shift Differentials | -100 | -39.5 | -22.2 | 34.2 | 18.9 | 16 |
| Paid Holidays | 2.8 | -33.1 | -13.2 | 55.3 | 37.2 | 23.2 |
| Paid Personal Leave | -0.9 | 28.3 | -18.6 | -39.4 | -31.5 | -28.6 |
| Paid Sick Leave | -20 | -45.1 | -2.5 | 12.7 | 40.9 | 29.8 |
| Paid Vacation | -32.2 | -27.1 | -35.5 | 21.7 | 63.3 | 31.1 |
| Retirement Plan | -28.9 | 8.1 | -18.1 | -32.8 | -8.3 | -11.7 |
| Short-Term Disability | 384.8 | 67.7 | 16.7 | 214.9 | 58.9 | 73.5 |
| Vision Plan | 1,082.10 | 150 | 197.4 | 65.4 | 24.8 | 34.1 |
| Number of Employees Per Company | ||||||
| 1-4 | 5-9 | 1-19 | 20-49 | 50+ | Total | |
| Total of Full- & Part-Time Jobs | ||||||
| Total Jobsa | -5.60% | |||||
| Benefit Type | ||||||
| Child Care | 13.7 | -61.8 | -22.6 | 1.5 | -66.1 | -59.1 |
| Dental Plan | -7.7 | 32.5 | 4 | -12.6 | -9.2 | -7.3 |
| Dependent Health Ins. | -8.9 | 22.3 | -5.4 | -15 | -8.1 | -7.8 |
| Educational/Tuition Assist. | -21.7 | -4.2 | 15.3 | -10.7 | -7.2 | -6.6 |
| Flexible Spending Account | 0.8 | 34.3 | 34.9 | -11.6 | -12.9 | -9.8 |
| Health Insurance | -3.7 | 12.5 | -4.6 | -14.1 | -8.3 | -7.7 |
| Hiring Bonus | -20 | -23.4 | -18.5 | -34.6 | -3 | -8 |
| Life Insurance | -17.8 | 16.6 | 12.3 | -19.9 | -9.1 | -8.7 |
| Long-Term Disability | -5.1 | 33.8 | 3.2 | -6 | -15.3 | -12.5 |
| Operate in Shifts | -60.7 | -18.5 | -0.5 | -1.9 | 9.6 | 5.8 |
| Shift Differentials | -54.9 | 26 | -11.4 | -9.1 | 14.1 | 11.6 |
| Paid Holidays | -1.3 | -7.5 | 2.1 | -12 | -2.8 | -3.9 |
| Paid Personal Leave | -12.3 | 10.6 | 6.7 | -9.7 | -4 | -3.6 |
| Paid Sick Leave | -2.2 | 6.2 | 18 | -12.3 | 6.3 | 4.4 |
| Paid Vacation | -7.7 | 2.1 | -6.3 | -17.6 | 10.8 | 3.1 |
| Retirement Plan | -17.4 | 0.8 | -2.3 | -26.6 | -10.3 | -11.7 |
| Short-Term Disability | -24.3 | 35.5 | -4.8 | -16.1 | -24.6 | -20.8 |
| Vision Plan | 4.1 | 28.1 | 16.9 | -5.8 | -0.6 | 0.4 |
| aThe difference in the percent of total jobs from 2008 to 2010 is calculated as the percent of total jobs for 2010 minus the percent of total jobs for 2008. The difference in the percent of total jobs is not the sum of differences for each benefit type. | ||||||
| Enrolleda (as of June 30) | Enrolledb (Unduplicated Count) | |||||
|---|---|---|---|---|---|---|
| State Fiscal Year | N | Net Change | % | N | Net Change | % |
| Change | Change | |||||
| 2007 | 59,291 | N/A | N/A | 79,607 | N/A | N/A |
| 2008 | 58,938 | -353 | -0.60% | 78,757 | -850 | -1.10% |
| 2009 | 64,533 | 5,595 | 9.50% | 82,175 | 3,418 | 4.30% |
| 2010 | 68,692 | 4,159 | 6.40% | 88,519 | 6,344 | 7.70% |
| aEligible to receive healthcare services for June. | ||||||
| bAll individuals who were eligible to receive healthcare services at any point in time during the fiscal year. | ||||||
| N/A - Not available. | ||||||
| Source: Wyoming Department of Health, Equality Care Report, Fiscal Years 2008-2010. Retrieved November 7, 2011, from http://www.health.wyo.gov/healthcarefin/equalitycare/index.html. | ||||||
| Benefit Type | Full-Time | Part-Time |
|---|---|---|
| Child Care | 2.50% | 1.40% |
| Dental Plan | 29.20% | 3.40% |
| Dependent Health Ins. | 35.50% | 3.90% |
| Educational/Tuition Assist. | 22.20% | 8.70% |
| Flexible Spending Account | 12.20% | 2.40% |
| Health Insurance | 44.60% | 6.00% |
| Hiring Bonus | 4.90% | 0.60% |
| Life Insurance | 27.50% | 3.50% |
| Long-Term Disability | 12.70% | 1.80% |
| Paid Holidays | 56.00% | 17.70% |
| Paid Personal Leave | 25.30% | 6.20% |
| Paid Sick Leave | 27.80% | 5.10% |
| Paid Vacation | 52.70% | 11.30% |
| Retirement Plan | 32.30% | 6.20% |
| Operate in Shifts | 32.30% | 6.00% |
| Shift Differentials | 30.70% | 26.00% |
| Short-Term Disability | 12.30% | 2.10% |
| Vision Plan | 17.80% | 3.50% |