
Economic Indicators
The consumer price index increased 1.8% from November 2011 to November 2012.
| Nov | Oct | Nov | Percent Change | ||||
|---|---|---|---|---|---|---|---|
| 2012 (p) | 2012 (r) | 2011 (b) | Month | Year | |||
| Wyoming Total Nonfarm Employment | 286,000 | 290,000 | 284,700 | -1.4 | 0.5 | ||
| Wyoming State Government | 17,600 | 17,700 | 17,500 | -0.6 | 0.6 | ||
| Laramie County Nonfarm Employment | 46,200 | 46,100 | 45,100 | 0.2 | 2.4 | ||
| Natrona County Nonfarm Employment | 41,600 | 42,100 | 41,100 | -1.2 | 1.2 | ||
| Selected U.S. Employment Data | |||||||
| U.S. Multiple Jobholders | 7,235,000 | 6,976,000 | 7,083,000 | 3.7 | 2.1 | ||
| As a percent of all workers | 5.0% | 4.8% | 5.0% | N/A | N/A | ||
| U.S. Discouraged Workers | 979,000 | 813,000 | 1,096,000 | 20.4 | -10.7 | ||
| U.S. Part Time for Economic Reasons | 7,994,000 | 7,870,000 | 8,271,000 | 1.6 | -3.3 | ||
| Wyoming Unemployment Insurance | |||||||
| Weeks Compensated | 20,039 | 17,577 | 23,867 | 14.0 | -16.0 | ||
| Benefits Paid | $6,682,178 | $6,059,319 | $7,428,837 | 10.3 | -10.1 | ||
| Average Weekly Benefit Payment | $333.46 | $344.73 | $311.26 | -3.3 | 7.1 | ||
| State Insured Covered Jobs1 | 267,847 | 271,952 | 263,481 | -1.5 | 1.7 | ||
| Insured Unemployment Rate | 2.7% | 2.1% | 2.5% | N/A | N/A | ||
| Consumer Price Index (U) for All U.S. Urban Consumers | |||||||
| (1982 to 1984 = 100) | |||||||
| All Items | 230.2 | 231.3 | 226.2 | -0.5 | 1.8 | ||
| Food & Beverages | 234.7 | 234.7 | 230.7 | 0.0 | 1.8 | ||
| Housing | 223.8 | 223.7 | 220.0 | 0.0 | 1.7 | ||
| Apparel | 129.6 | 131.4 | 127.3 | -1.4 | 1.8 | ||
| Transportation | 214.5 | 220.2 | 211.4 | -2.6 | 1.5 | ||
| Medical Care | 418.7 | 418.4 | 404.9 | 0.1 | 3.4 | ||
| Recreation (Dec. 1997=100) | 114.8 | 114.8 | 113.2 | 0.0 | 1.4 | ||
| Education & Communication (Dec. 1997=100) | 134.7 | 134.8 | 132.8 | 0.0 | 1.5 | ||
| Other Goods & Services | 396.7 | 396.3 | 390.8 | 0.1 | 1.5 | ||
| Producer Prices (1982 to 1984 = 100) | |||||||
| All Commodities | 201.8 | 203.5 | 201.4 | -0.8 | 0.2 | ||
| Wyo. Bldg. Permits (New Privately Owned Housing Units Authorized) | |||||||
| Total Units | 115 | 150 | 356 | -23.3 | -67.7 | ||
| Valuation | $25,416,000 | $39,346,000 | $36,944,000 | -35.4 | -31.2 | ||
| Single Family Homes | 110 | 130 | 112 | -15.4 | -1.8 | ||
| Valuation | $24,941,000 | $37,893,000 | $24,938,000 | -34.2 | 0.0 | ||
| Casper MSA2 Building Permits | 19 | 18 | 24 | 5.6 | -20.8 | ||
| Valuation | $3,070,000 | $3,894,000 | $4,143,000 | -21.2 | -25.9 | ||
| Cheyenne MSA Building Permits | 30 | 48 | 21 | -37.5 | 42.9 | ||
| Valuation | $1,631,000 | $6,704,000 | $3,030,000 | -75.7 | -46.2 | ||
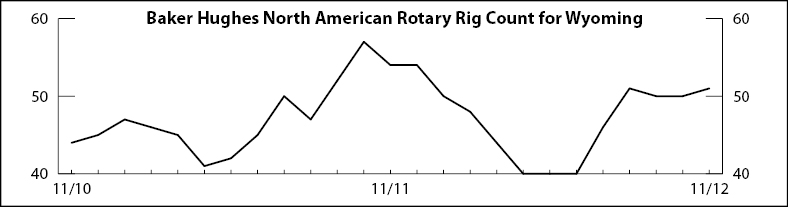
| Baker Hughes North American Rotary Rig Count for Wyoming | 51 | 50 | 54 | 2.0 | -5.6 | ||
|
|||||||
| (p) Preliminary. (r) Revised. (b) Benchmarked. | |||||||
| 1Local Area Unemployment Statistics Program estimates | |||||||
| 2Metropolitan Statistical Area | |||||||
| Note: Production worker hours and earnings data have been dropped from the Economic Indicators page because of problems with accuracy due to a small sample size and high item nonresponse. The Bureau of Labor Statistics will continue to publish these data online at http://www.bls.gov/eag/eag.wy.htm. | |||||||