
The Survey of Occupational Injuries and Illnesses for 2009 and 2010
by: Valerie A. Davis, Senior Statistician
See Related Tables and Figures
This article summarizes the results of the 2009 and 2010 Wyoming Survey of Occupational Injuries and Illnesses. The data include estimates of incidence rates by industry and the nature of the injury or illness. Also included are some worker demographics, such as age and gender. State and local government data are discussed briefly. An estimated 2,710 occupational injury and illness cases with days away from work occurred in private industry in Wyoming in 2009, and 2,510 in 2010, both with incidence rates of 4.0.
The Research & Planning (R&P) section of the Wyoming Department of Workforce Services annually conducts the Survey of Occupational Injuries and Illnesses (SOII) for Wyoming in cooperation with the U.S. Bureau of Labor Statistics (BLS) as part of a nationwide data collection effort. The survey data identify the estimated incidence rates (see Definitions) of injuries and illnesses at the industry level. Detailed characteristics of severe injuries and illnesses (those that result in days away from work) also are identified by the survey. This information can be used by employers and safety awareness groups to focus on prevention. The data are also used by regulatory agencies for tracking injury and illness trends to target safety resources.
Data from Wyoming’s Workers’ Compensation files are also available for comparison, as they should correspond with the SOII data (see http://doe.state.wy.us/LMI/safety/Workers_Compensation_Quarterly_Tables.xls). For example, as an average there were 3,392 total initial claims in 2009 and 3,373 in 2010 (R&P, 2011). The estimated number of occupational injury and illness cases with days away from work for 2009 for all ownerships was 3,420 and for 2010 it was 3,200. The SOII numbers are based on samples, while the workers’ compensation number are based on actual counts.
Background
Definitions
- Case of job transfer
- An injured or ill employee was assigned to a job other than his or her regular job for part of the day other than the day of injury or illness.
- Case of restricted duty
- An employee was kept from performing one or more routine functions (work activities the employee performed at least once per week) of his or her job, or was kept from working a full workday, or a licensed health care professional recommended either of the above.
- Cases with days away from work
- Severe cases that counted the day after the injury or onset of the illness, which may or may not include days of job transfer or restriction. Up to 180 days away from work (and/or days of job transfer or restriction) are counted for each injury.
- Event or exposure
- The manner in which the injury or illness was produced or inflicted, such as falls, overexertion, or repetitive motion.
- Incidence rate
- Represents the number of injuries and illnesses per 100 full-time workers, calculated as (N/EH) x 200,000 where:
- N = number of injuries and illnesses
- EH = total hours worked by all employees during the calendar year
- 200,000 = base for 100 equivalent full-time workers (working 40 hours per week, 50 weeks per year).
- Mandatory survey
- Participation by private sector employers is required by Public Law 91-596 by the Bureau of Labor Statistics (BLS). Participation by public sector employers is required by law by Wyoming OSHA, as Wyoming is a State Plan State. If an employer receives a survey from the BLS, even if they are partially exempt by OSHA due to having less than 11 employees for example, they must still complete the survey.
- Nature of injury or illness
- The physical characteristics of the disabling injury or illness, such as cuts, fractures, or sprains.
- Other recordable cases -
- Cases not involving days away from work or days of job transfer or restricted duty but requiring medical treatment beyond first aid. Other recordable cases include, for example, stitches, prescription medication, a concussion, loss of consciousness, medical removal from job site, musculoskeletal disorders, or other significant diagnosed injury or illness.
- Out of scope
- An employer who did not have employees for the survey year or an employer whose employment size class or industry code changed.
- Part of body
- The part of the body directly linked to the nature of injury or illness cited, such as back, finger, or eye.
- Relative standard error
- A percentage of the estimate. The standard error defines a range (confidence interval) around the estimate. The approximate 95% confidence interval is the estimate plus or minus twice the standard error.
- Source of injury or illness
- The object, substance, exposure, or bodily motion that directly caused the disabling condition, such as chemical, vehicle, or machinery.
For this mandatory survey (see Definitions), 2,200 Wyoming private and 290 public sector (state and local government) employers were notified in December 2009 to keep records of their firms’ work-related injuries and illnesses during 2010 using the Occupational Safety & Health Administration (OSHA) 300 forms. Along with data from the original firms sampled, occupational injury and illness data for 202 employers (from the mining, except oil & gas, and railroad industries) were added from administrative records developed during required incident reporting provided to BLS by two federal agencies: the U.S. Department of Labor, Mine Safety & Health Administration (MSHA) and the U.S. Department of Transportation, Federal Railroad Administration (FRA). In December 2008, R&P notified 2,296 Wyoming private and 304 public sector (state and local government) employers to keep records during 2009. The 2009 sample from MSHA and FRA included 199 employers. In January of both survey years, public and private employers were sent a pamphlet describing how to transfer data from the OSHA 300 form to questionnaires available on the Internet or by e-mail.
Employers were asked to respond within 30 days. Two subsequent mailings were sent to non-respondents to increase response rates, after which these employers were contacted by phone to acquire the information. Employers were also contacted to verify or correct data. The data collection periods lasted approximately seven months. After the data collection periods, data and results were reviewed by regional and national BLS staff and incidence rates calculated.
Between 10.0% and 11.0% of units were determined to be out of scope, had gone out of business since the sample was drawn, had a duplicate record, or otherwise did not meet the criteria for inclusion in the survey. Of the remaining sampled employers, 95% in 2009 and 94% in 2010 provided useable responses for the survey.
Methodology
Data were reported by employers on the basis of a single incident or occurrence. If an employee experienced more than one work-related injury or illness during the calendar year, each incident was reported separately and is referred to as a case. If an incident injured more than one employee, each employee was reported as a case on the questionnaire. To be categorized as a recordable case, an injury or illness must have required medical treatment beyond first aid. For additional information see the OSHA Recordkeeping Handbook online.
The BLS produces incidence rate estimates from the gathered data. Incidence rates by industry indicate the number of illnesses or injuries per 100 full-time employees. The cases deemed the most serious are those that involve days away from work. The BLS counts up to a cap of 180 days away from work per case, even though there are cases with more days. Cases associated with employees who do not require time off work beyond the day of injury are not included. Cases with days of restricted duty or job transfer are counted in the summary of injuries and/or illnesses. Also, other recordable cases, those requiring medical treatment beyond first aid, are counted in the summary. These latter two categories were not detailed in the case and demographics for 2009 or 2010, only cases with days away from work. In 2011, cases with job transfer or restriction for the following six private North American Industry Classification System (NAICS) sectors will also have demographic and injury/illness characteristics provided by employers:
- 238 – Specialty trade contractors
- 311 – Food manufacturing
- 444 – Building materials & garden equipment supplies dealers
- 481 – Air transportation
- 493 – Warehousing & storage
- 623 – Nursing & residential care facilities
Several data collection problems occurred in both the 2009 and 2010 survey rounds. One problem was that some smaller Wyoming employers did not have access to the Internet or e-mail. Firms that lacked Internet or e-mail access contacted R&P to be sent a 12-page booklet to enable them to provide the information. A second and related problem was that some employers who had Internet or e-mail access had trouble using the BLS website or the electronic PDF form (employers were sent the PDF form by e-mail upon request). The national office would then track down problems and correct them. Despite these challenges, Wyoming achieved a 95% response rate in 2009 overall; due to these and some additional changes in the collection process for 2010, the response rate decreased to 94%.
Results
Incidence Rates
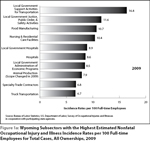
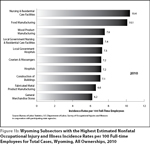
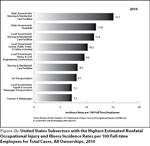
The total estimated incidence rate in Wyoming for all ownerships was 4.1 injuries and illnesses per 100 full-time employees each in 2009 and 2010. The private sector estimated incidence rate was 4.0 for both years. The rate for state and local government was 4.9 (2009) and 4.7 (2010). For state government alone, the rate was 2.8 (2009) and 3.4 (2010); for local government alone, the rate was 5.7 (2009) and 5.2 (2010). Four of the 10 subsectors with the highest estimated incidence rates nationally were also found in Wyoming’s top 10 for 2009; three of the 10 subsectors nationally were also found in Wyoming’s top 10 for 2010 (See Figures 1a, 1b, 2a, and 2b). The relative standard error computed by BLS was used to calculate the estimates, with a 95% confidence interval. The tables with the relative standard errors are available upon request from R&P.
 |  |
| Figure 1a | Figure 1b |
 |  |
| Figure 2a | Figure 2b |
 | |
| Table 1 | |
 |  |
| Figure 3a | Figure 3b |
 |  |
| Figure 4a | Figure 4b |
 |  |
| Figure 5a | Figure 5b |
 |  |
| Figure 6a | Figure 6b |
| |
| Table 2 | |
Case and Demographic Data
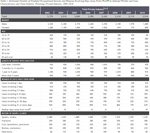
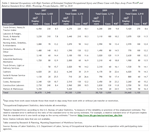
Table 1 shows the estimated number of nonfatal occupational injuries and illnesses in Wyoming by selected characteristics from 2003 to 2010. These data show only cases with days away from work; they do not include cases that resulted solely in job transfer or restricted duty or those that were other recordable cases. There appears to be a general downward trend in the number of employees by occupation and the number of cases.
Worker Characteristics
In 2009, men made up 54.5% of Wyoming’s workforce (BLS, 2010). Of the more serious work-related injuries and illnesses in 2009, 72.7% involved men. This contrasts with the Census of Fatal Occupational Injuries & Illnesses (CFOI) data showing that 94.7% of Wyoming work-related fatalities in 2009 were men (CFOI, 2010). While 45.5% of Wyoming’s workforce was women, only 26.2% of workers who became more seriously injured or ill at work in 2009 were women.1
In 2010, 54.0% of Wyoming’s workers were men (BLS, 2011). Of the total work-related injuries and illnesses with days away from work in 2010, 66.9% involved men. This contrasts with the CFOI data showing that 82.4% of Wyoming fatalities in 2010 were men (CFOI, 2011). In 2010, 46.0% of Wyoming’s workers were women (BLS, 2011), but only 31.9% of workers who became more seriously injured or ill at work in 2010 were women.2
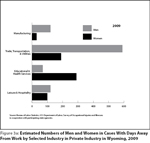
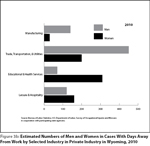
For 2009, in the trade, transportation, & utilities industry, an estimated 590 men and 190 women were cases with days away from work (see Figure 3a); for 2010 in the same industry, an estimated 450 men and 200 women had more serious work-related injuries or illnesses (see Figure 3b). In 2009, manufacturing had four times the number of men (120) than women (30) involved in cases with days away from work; in 2010, more than four times the number of men (140) than women (30) had more serious work-related injuries or illnesses. More women than men were cases with days away from work in the educational & health services industry (290 and 70, respectively, in 2009; 310 and 70, respectively, in 2010). For the leisure & hospitality industry, approximately the same number of men (120) and women (100) were cases with days away from work in 2009; more women (160) than men (120) had more serious work-related injuries or illnesses in 2010.
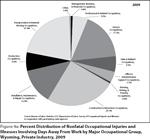
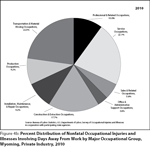
Out of the major occupational groups, construction & extraction and transportation & material moving had a higher-than-average percentage of total workers with work-related injuries or illnesses for both 2009 and 2010 (see Figures 4a and 4b). Far more men than women usually work in these occupational groups. Consequently, more men than women were injured in these types of occupations. These workers included extraction workers, all other; truck drivers, heavy & tractor-trailer; and construction laborers. However, more women than men were injured in service occupations such as nursing aides and maids & housekeeping cleaners because more women than men were usually employed in these occupations.
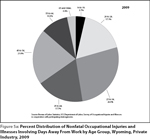
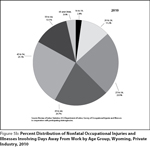
The highest percentage of injuries and illnesses by age group in 2009 was for workers age 25 to 34 (26.9%; see Figure 5a). For 2010, the highest percentage by age group was for workers age 45 to 54 (25.1%; see Figure 5b). In contrast, the age group with the most injuries and illnesses in 2008 was age 35 to 44 at 24.3% (see Table 1).
Injury and Illness Characteristics
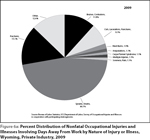
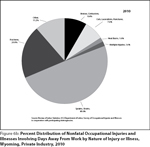
Sprains and strains accounted for the largest percentage of injuries resulting in days away from work. (46.1% in 2009 and 49.6% in 2010; see Figures 6a and 6b). The injuries were often caused by falling, lifting, twisting and bending, standing or sitting, throwing, or reaching. In fact, sprains and strains were the leading cause of injuries resulting in days away from work from 2002 through 2010. This suggests that employers should place additional emphasis on sprain and strain prevention.
Occupation
Table 2 shows selected occupations that had the highest numbers of cases from 2007 to 2010. For example, the number of truck drivers, heavy & tractor trailer, involved in cases with days away from work decreased from 220 in 2008 to 200 in 2009 (not a significant decrease) and then increased to 270 in 2010 (a significant increase). The number of extraction workers, all other, involved in these cases decreased from 130 in 2008 to 80 in 2009 (a significant decrease) and then increased to 100 in 2010 (not a significant increase). The annual changes in the survey sample lead to some of the annual variations in each industry.
From 2007 to 2010, truck drivers, heavy & tractor trailer, was one occupation continuously in the top five with the most injuries and illnesses resulting in days away from work; another occupation continuously in the top five was laborers & freight, stock, & material movers, hand. This is due to the number of workers and inherent dangers (possible traffic accidents, lifting heavy objects) present in these two occupations. More safety measures appear to be needed to avoid these dangers.
Much of the annual variation in the number of work-related injuries and illnesses could be related to the nature of Wyoming’s jobs. Another factor could be an increase or decrease in employment for certain occupations. For example, in 2008 there were an estimated 3,440 laborers & freight, stock, & material movers, hand in Wyoming, (Wyoming Occupational Employment and Wages, 2009). In 2009, that number decreased to 3,110 workers (-9.6%; Wyoming Occupational Employment and Wages, 2010). For 2010, the number decreased again to 3,070 workers (-1.0%; Wyoming Occupational Employment and
Wages, 2011). The percentage of these workers who were injured was 6.1% in 2008, 5.8% in 2009, and 3.9% in 2010. R&P research has shown that the number of work place fatalities is related to changes in overall employment (Manning, 2010). This may also be true for occupational injuries and illnesses.
Summary
From 2009 to 2010, Wyoming experienced an estimated decrease of work-related injuries and illnesses resulting in days away from work for private industry. Overall, men continued to experience work-related injuries and illnesses more frequently than women. This was likely due, in part, to higher ratios of men to women employed in industries with higher incidence rates; the exceptions were educational & health services and leisure & hospitality. In general, older workers in more dangerous professions who had less job experience incurred more work-related injuries and illnesses in 2010; the same was also generally true of prior years. More detail on 2009 and 2010 data, historical data, and further documentation are available at http://doe.state.wy.us/LMI/OSH/toc.htm.
For more information, contact Valerie A. Davis at (307) 473-3838 or val.davis@wyo.gov.
References
U.S. Bureau of Labor Statistics. (2011, March). Employment status of the civilian noninstitutional population by sex, age, race, Hispanic or Latino ethnicity, and marital status, 2010 annual averages. Division of Local Area Unemployment Statistics. (Preliminary 2010 data on employment status by state and demographic group). Retrieved December 16, 2011, from http://www.bls.gov/opub/gp/pdf/gp10_14.pdf
U.S. Bureau of Labor Statistics. (2010, March). Employment status of the civilian noninstitutional population by sex, age, race, Hispanic or Latino ethnicity, and marital status, 2009 annual averages. Division of Local Area Unemployment Statistics. Retrieved December 16, 2011, from http://www.bls.gov/pub/gp/pdf/gp09full.pdf
Census of Fatal Occupational Injuries and Illnesses, Wyoming. (2010). Retrieved December 16, 2011 from http://doe.state.wy.us/LMI/CFOI/toc.htm
Census of Fatal Occupational Injuries and Illnesses, Wyoming. (2009). Retrieved November 10, 2011 from http://doe.state.wy.us/LMI/CFOI/CFOI_09/toc.htm
Manning, P. (2010). Employment Change and Impacts on Workplace Fatalities in Wyoming. (August, 2010). Wyoming Department of Employment, Research & Planning, Casper: WY. Retrieved November 10, 2011 from http://doe.state.wy.us/LMI/safety/CFOI_Reg_Model_2010.pdf
Research & Planning, Wyoming Department of Workforce Services. (2011). Workers Compensation Quarterly Tables, 2006Q1-2010Q4. Retrieved January 20, 2012 from http://doe.state.wy.us/LMI/safety/Workers_Compensation_Quarterly_Tables.xls
Wyoming Occupational Employment & Wages. (2011, September). Retrieved November 10, 2011, from http://doe.state.wy.us/LMI/EDS2011SeptECI/TOC000.HTM
Wyoming Occupational Employment & Wages. (2010, September). Retrieved November 10, 2011, from http://doe.state.wy.us/LMI/EDSSept2010ECI/TOC000.HTM
Wyoming Occupational Employment & Wages. (2009, December). Retrieved November 10, 2011, from http://doe.state.wy.us/LMI/EDSpub200909/TOC000.HTM
1 Data are not available to determine whether
the remaining 1.1% of workers who became
injured or ill in 2009 were men or women.
2 Data are not available to determine whether
the remaining 1.2% of workers who became
injured or ill in 2010 were men or women.