
Methodology
Survey Background and Methodology
The initial nursing research conducted by R&P occurred in 2002 and 2003 and used only the Wyoming Board of Nursing files and administrative databases to study work force behavior of nurses (Glover, 2002a; Glover, 2002b; Glover, 2003). This research yielded information on retention, turnover, and other transition behaviors. While the data were useful to the nursing community, more information was required to fully understand the issues facing Wyoming nurses.
Through feedback by a nurse advisory council (Ellsworth & Szuch, 2008), the Wyoming Hospital Association, the Wyoming Long-Term Care Association, the Wyoming Healthcare Commission, Wyoming Medical Center staff, and members of the nursing community at statewide nursing summits, R&P initiated a three-faceted approach to study nurse behavior.
The survey process began in 2007 with an extensive literature search. The review was instrumental in developing hypotheses that were then used to design the survey instrument. The questionnaire, developed with the assistance of a nurse advisory committee, attempted to measure staffing levels, non-nursing tasks, wages and benefits, and safety issues, as well as other theoretically relevant variables. Two groups of nurses were surveyed in 2007: nurses working in ambulatory care (includes private doctor’s offices and surgery centers) and nurses working in hospitals and long-term care centers (Knapp, 2008). See Ellsworth & Szuch, 2008, for detailed information on the project history and questionnaire development.
It was decided that a questionnaire should be developed for public health nurses because they are dissimilar to both groups previously surveyed. Karen Ouzts, State Public Health Supervisor, served as the project’s advisor. Her input identified the goals of the research, helped modify the questionnaire, and provided context for the findings.
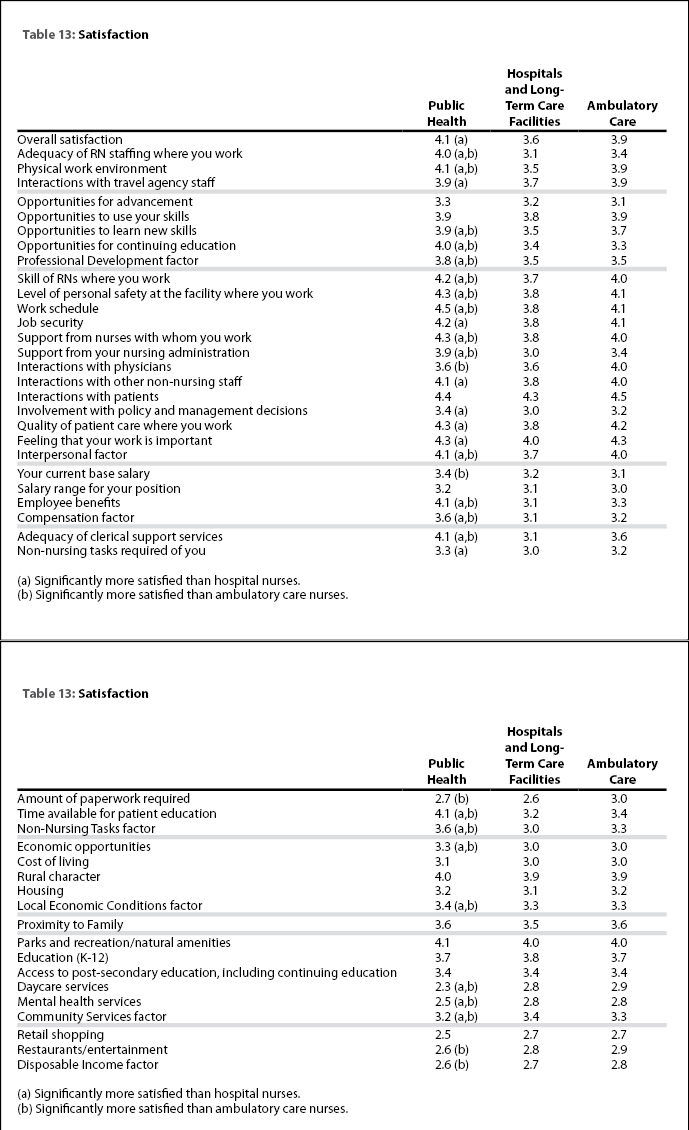
The questionnaire previously used for hospitals and long-term care facilities was nearly identical to the questionnaire for ambulatory care (Ellsworth & Szuch, 2008). The difference was the addition of questions regarding overtime and shift changes. As public health nurses typically work a standard daytime schedule, it was decided to base the questionnaire on the form used to survey nurses working in ambulatory care (see Appendix A). Questions regarding satisfaction (overall satisfaction with workplace issues, overall satisfaction with the nursing occupation, and satisfaction with the community) were left unaltered. Questions addressing education, tenure, and motivation for working in public health were added. The reference date given to standardize the responses was September 12, 2008.
All Wyoming public health nurses were mailed an advance letter to their home address in order to inform them of the upcoming survey. The mailing also served as a form of address refinement. The advance letters (see Appendix A) were mailed on September 19, 2008. Of the 164 public health nurses reported working by the Wyoming Department of Health, one could not be located and was removed from the survey group. There were 18 total address changes, of which 4 were sent to the relevant public health office because home addresses could not be located.
The remaining 163 nurses were assigned a confidential random identification number and were mailed a copy of the questionnaire, a cover letter explaining the purpose of the survey, and a stamped, addressed return envelope. The initial questionnaire was mailed on October 2, 2008. Those who had not responded by October 20, 2008, were mailed a second copy of the questionnaire.
Retirement Concerns
According to a recent survey (Ellsworth & Szuch, 2008) of Wyoming nurses, nearly 60% of respondents were 45 or older (Saulcy, 2008). Leonard (2009) contributed to the findings by showing that in the second quarter of 2008, the average age of a working nurse in Wyoming was 44.6 with about half (49.9%) age 45 or older. Nurses in hospitals were younger than nurses in ambulatory care (43.9 and 45.0, respectively), however, both were younger than nurses in long-term care (47.9). Long term care also employed the largest percentage of nurses over age 45 (60.8%). According to another survey (Ouzts, 2008), the average age of public health nurses was 50. Sixty-five of 124 (52%) expected to retire within a decade.
Using the Wyoming Board of Nursing Licensing file, researchers were able
to calculate the average age of employed public health nurses in the state
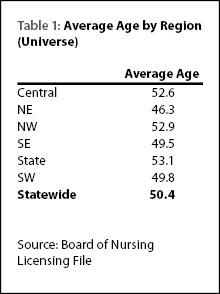 and by region. Table 1 shows that the average age for nurses in public
health was 50.4. Other than the state supervisors, the northwest region
had the highest average age of 52.9 years, followed closely by the central
region (52.6). The northeast region had the youngest nurses with an average
age of 46.3 years.
and by region. Table 1 shows that the average age for nurses in public
health was 50.4. Other than the state supervisors, the northwest region
had the highest average age of 52.9 years, followed closely by the central
region (52.6). The northeast region had the youngest nurses with an average
age of 46.3 years.
Similarly, Table 2 shows the number of employed public
health nurses by age 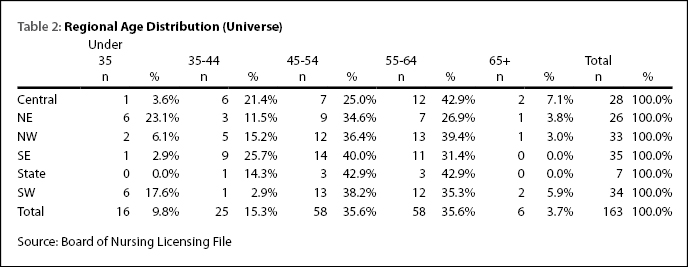 group and region. Statewide, the largest number of
nurses were 45-54 and 55-64 years of age (58, or 35.6%, in each). The retirement
age used in research is usually based on the social security eligibility
ages of 62 or 65 (Uccello, 1998; U.S. GAO, 2001). Because there were also
6 who were 65 or older, there were 64 (39.3%) eligible for retirement within
seven years. Of all the defined areas, the central region was the most
likely to face impending retirements with 50.0% of the public health nurse
work force in the two oldest age groups. The northeast region was least
likely to face retirement with only 30.7% within the same age brackets.
group and region. Statewide, the largest number of
nurses were 45-54 and 55-64 years of age (58, or 35.6%, in each). The retirement
age used in research is usually based on the social security eligibility
ages of 62 or 65 (Uccello, 1998; U.S. GAO, 2001). Because there were also
6 who were 65 or older, there were 64 (39.3%) eligible for retirement within
seven years. Of all the defined areas, the central region was the most
likely to face impending retirements with 50.0% of the public health nurse
work force in the two oldest age groups. The northeast region was least
likely to face retirement with only 30.7% within the same age brackets.
Description of Sample
Response Rate
The final response rate was 83.4% (136 returned questionnaires) after
two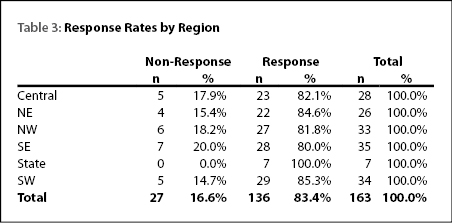 mailings. Response rate was defined as all returned questionnaires
divided by the total number of questionnaires sent out. There were no examples
of returned questionnaires without useable data. Table 3 shows the number
and percentage of respondents by region. All of the state supervisory staff
returned questionnaires. Of the geographic areas, the southwest region
had the highest response rate with 85.3% of questionnaires returned. The
lowest response rate, 80.0%, was in the southeast region.
mailings. Response rate was defined as all returned questionnaires
divided by the total number of questionnaires sent out. There were no examples
of returned questionnaires without useable data. Table 3 shows the number
and percentage of respondents by region. All of the state supervisory staff
returned questionnaires. Of the geographic areas, the southwest region
had the highest response rate with 85.3% of questionnaires returned. The
lowest response rate, 80.0%, was in the southeast region.
Table 4 shows response rates by age group. Overall, the 35-44 and 45-54 year-old groups were somewhat under-represented with only 72.0% and 81.0%,
respectively, responding. However, the response rates were still high enough
that bias is unlikely.
year-old groups were somewhat under-represented with only 72.0% and 81.0%,
respectively, responding. However, the response rates were still high enough
that bias is unlikely.
Age and Demographics Distribution
Region
The average age of respondents was essentially the same as the average
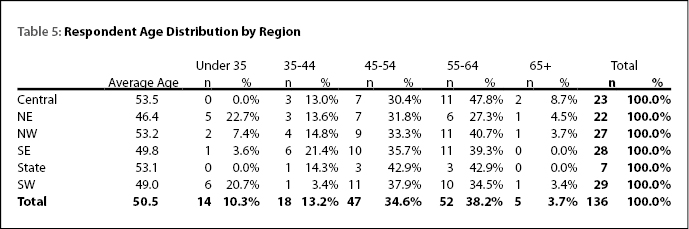 age for all nurses working in public health (50.5 and 50.4, respectively).
However, in this case, responding nurses in the central region were slightly
older than nurses in the northwest region (see Table 5). A total of 57
(41.9%) respondents will reach traditional retirement age within seven
years.
age for all nurses working in public health (50.5 and 50.4, respectively).
However, in this case, responding nurses in the central region were slightly
older than nurses in the northwest region (see Table 5). A total of 57
(41.9%) respondents will reach traditional retirement age within seven
years.
Position
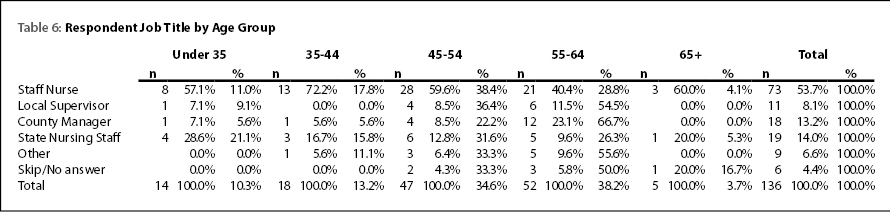
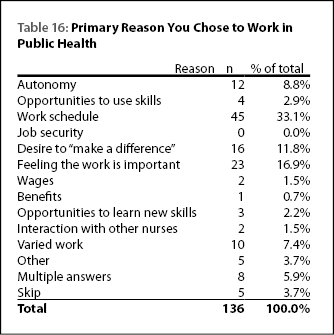
Question 2 (see Appendix A) asked respondents the title of their primary public health nursing position. The question was independent of funding source, as defined by the Wyoming Department of Health, and simply reflected how the nurse chose to classify his or her position. Overall, 53.7% selected “staff nurse,” 14.0% selected “state nursing staff,” and 13.2% selected “county manager.” The remainder were divided between “local supervisor,” “other,” and “skip/no answer,” which included both those who were no longer employed in public health and those who left the question blank.
As demonstrated in Table 6, every age group was comprised mostly
of ![]() “staff nurses” with the 35-44 year-old group having the largest percentage
(72.2%) and the 55-64 year-old group having the smallest percentage (40.4%).
Supervisors, both local and county, were largely in the 55-64 year-old
group while the “state nursing staff” were more evenly distributed among
the age groups.
“staff nurses” with the 35-44 year-old group having the largest percentage
(72.2%) and the 55-64 year-old group having the smallest percentage (40.4%).
Supervisors, both local and county, were largely in the 55-64 year-old
group while the “state nursing staff” were more evenly distributed among
the age groups.
Retirement plans
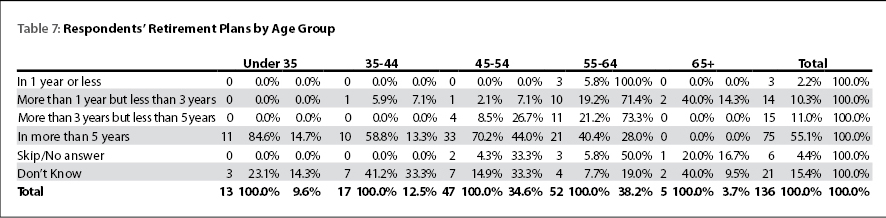
Overall, three respondents (2.2%) reported that they expected to retire
in ![]() one year or less (see Table 7). Another 14 (10.3%) reported retirement
plans in more than one year but less than three years and 15 (11.0%) in
more than three years but less than five years. Together, 23.5% of respondents
expected to retire within five years.
one year or less (see Table 7). Another 14 (10.3%) reported retirement
plans in more than one year but less than three years and 15 (11.0%) in
more than three years but less than five years. Together, 23.5% of respondents
expected to retire within five years.
As expected, most of those expecting to retire within the near future were in the 55-64 year-old group. Respondents younger than 55 generally answered either “In more than 5 years” or “Don’t know.” Those under 35 were most likely to select “in more than 5 years” while those 35-44 were considerably more likely to select “don’t know” than the other groups.
Education
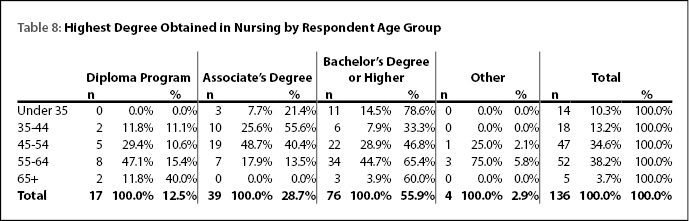
On a percentage basis, the youngest public health nurses have more education
than the older nurses (see Table 8). Only 21.4% of nurses under ![]() age 35
have less than a bachelor’s degree. However, the youngest nurses only constitute
14.5% of respondents with at least a bachelor’s degree. The majority (44.7%)
were in the 55-64 year-old category, meaning that if the nurses retire
when they reach traditional retirement age, public health could lose almost
half of the most educated in nursing within seven years. The assumed successors
to the retiring nurses (those age 35-44 and 45-54) generally had less education.
One-third (33.3%) of 35-44 year-old respondents and 46.8% of 45-54 year-old
respondents had at least a bachelor’s degree. While the successor nurses
will likely have ample experience to do the job well, the formal education
level will be below the nationally recommended level.
age 35
have less than a bachelor’s degree. However, the youngest nurses only constitute
14.5% of respondents with at least a bachelor’s degree. The majority (44.7%)
were in the 55-64 year-old category, meaning that if the nurses retire
when they reach traditional retirement age, public health could lose almost
half of the most educated in nursing within seven years. The assumed successors
to the retiring nurses (those age 35-44 and 45-54) generally had less education.
One-third (33.3%) of 35-44 year-old respondents and 46.8% of 45-54 year-old
respondents had at least a bachelor’s degree. While the successor nurses
will likely have ample experience to do the job well, the formal education
level will be below the nationally recommended level.
Education Distribution
Region
Table 9 shows the education distribution of respondents by region. Over
half (55.9%) of all respondents had at least a bachelor’s degree in nursing.
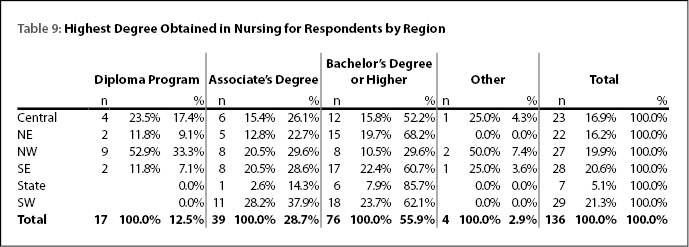 The next largest percentage (28.7%) had an associate’s degree.
The northeast region employed the largest percentage of nurses with at
least a bachelor’s degree (68.2%) while the northwest region employed the
smallest percentage (29.6%).
Respondents with an associate’s degree were fairly evenly distributed throughout the regions of the state, however, a somewhat larger proportion was located in the southwest region. Diploma program graduates were most commonly working in the northwest region.
Position
As seen in Table 10, graduates from a diploma program
were most likely to be working as staff nurses (58.8%) although 17.6% were
working as county  managers. Respondents with an associate’s degree also
were most likely to be working as staff nurses (74.4%) with some (12.8%)
working as state nursing staff. Those with a bachelor’s degree or higher
were most likely to be staff nurses (44.7%), however, there were also many
employed as county managers (15.8%), local supervisors (10.5%), or state
nursing staff (14.5%).
managers. Respondents with an associate’s degree also
were most likely to be working as staff nurses (74.4%) with some (12.8%)
working as state nursing staff. Those with a bachelor’s degree or higher
were most likely to be staff nurses (44.7%), however, there were also many
employed as county managers (15.8%), local supervisors (10.5%), or state
nursing staff (14.5%).
Retirement plans
Because those with a bachelor’s degree or higher composed the largest
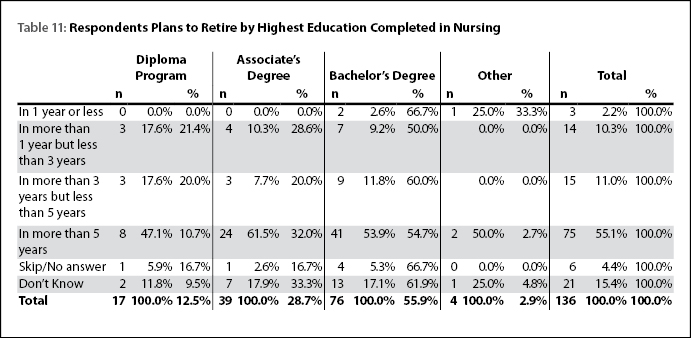 proportion of respondents, they similarly composed the largest proportion
of all expected retirement groups. For example, 66.7% of respondents who
planned to retire within one year held a bachelor’s degree or higher compared
to the 23.6% who expected to retire within five years (see Table
11). Comparatively,
about one-third (35.2%) of graduates from a diploma program expected to
retired within five years.
proportion of respondents, they similarly composed the largest proportion
of all expected retirement groups. For example, 66.7% of respondents who
planned to retire within one year held a bachelor’s degree or higher compared
to the 23.6% who expected to retire within five years (see Table
11). Comparatively,
about one-third (35.2%) of graduates from a diploma program expected to
retired within five years.
Tenure Distribution
Region
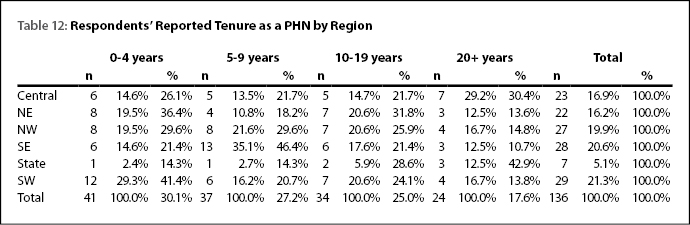
Table 12 shows, by region, the distribution of public
health nursing ![]() experience had by respondents. Overall, a slight majority
(30.1%) had the least amount of experience (0-4 years), followed by the
27.2% of respondents with 5-9 years.
experience had by respondents. Overall, a slight majority
(30.1%) had the least amount of experience (0-4 years), followed by the
27.2% of respondents with 5-9 years.
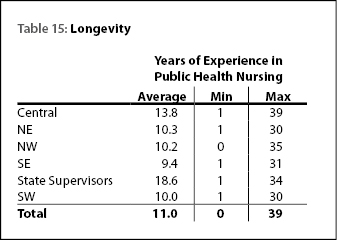
The southwest region employed the highest percentage of nurses with little experience in public health (41.4%). In contrast, only 21.4% of nurses in the southeast region had 4 years or less experience. At the other end of the spectrum, 42.9% of state supervisors had 20 years of experience or more. The central region, also, was comprised of experienced nurses with 30.4% having at least 20 years on the job.