A Closer Look at Occupational Projections for Wyoming, 2006-2016
text by: Sara Saulcy, Senior Economist
data by: Sylvia D. Jones, Senior Statistical and Research Analyst
Wyoming’s economy has grown during much of the present decade, largely due to mineral extraction, especially energy resources (Ellsworth & Saulcy, 2008). This is in contrast to the 1990s, when Wyoming’s economy grew more slowly than the nation’s (Harris, 2004).
To learn how Wyoming workers may fare into the middle of the next decade, this publication focuses on projected occupational growth from 2006 to 2016. Growth is also examined in relation to wages and educational requirements. Lastly, this report shows how projections were applied to a study that Research & Planning (R&P) developed for Central Wyoming College in early 2008.
Road Map for the Future
Development of projections to show the direction of Wyoming’s economy requires an assessment of the economy’s direction prior to the projection period. Projections were developed using 2006 as the base year and projected to 2016. To describe the labor market condition in 2006, this report first examines employment and wages from 2001 to 2006 before turning to the occupational projections themselves.
Occupational projections were developed from the 2006-2016 industry projections (see Bullard & Leonard, 2008) and data collected for the Occupational Employment Statistics (OES) survey. The occupational projections were then measured against the industry projections to ensure consistency. To provide a more complete view of projected occupational growth, additional data were attached from OES and other sources. These data included average annual and hourly wages, minimum education level required for entry into occupations, and comparisons of average wages against the federal poverty guideline for a family of four. The results demonstrate how the information can be applied to evaluate the quantity and quality of economic growth.
Industry projections use historical trends in employment within an industry to predict whether the industry is expected to expand or contract over the next decade. OES collects data at the establishment level on the number of employees in an occupation within an industry. In every even-numbered year, long-term (10-year) occupational projections are updated, while short-term (2-year) occupational projections are brought up to date in odd-numbered years. Due to data limitations, substate (i.e., regional) projections are constructed only for long-term projections. Each state develops industry and occupational projections using a similar methodology. Historical and current Wyoming industry and occupational projections may be found at http://doe.state.wy.us/LMI/projections.htm.
Industry Trends Influencing Occupational Growth, 2001 and 2006
In 2001 Wyoming’s nonagricultural wage and salary employment was 237,278; by 2006 it grew to 266,894, an increase of 29,616 (12.5%; see Table 1). The growth rate in goods-producing industries was more than double that of service-providing industries (25.2% compared to 10.8%). Mining had the largest net and percentage increases among goods-producing industries at 45.8% (8,319 jobs). It also led net and percentage growth across all sectors. Of the employment gains in mining, 76.5% (5,925 jobs) was due to support activities for mining. Net increases in service-providing industries were led by trade, transportation, & utilities (4,304) followed by educational & health services (3,054). Within health care & social assistance, ambulatory health care services added 1,354 jobs (21.5%), hospital employment rose by 48 jobs (1.7%), and nursing & residential care facilities added 317 jobs (7.7%).
Employment in health care firms is projected to increase substantially in the coming decades, largely due to the overall rise in the age of Wyoming’s population. By 2015, the number of people 65 and older is projected to increase to nearly 89,000, while the population of individuals age 18-24 is projected to be less than half that number (just under 40,000; Census Bureau, 2005). Depending on implemented policy changes, demand by health care firms for registered nurses in particular is expected to increase markedly between 2006 and 2014 (Leonard, 2008). Demand for other goods and services also will be affected by demographic changes (Gallagher, 2003).
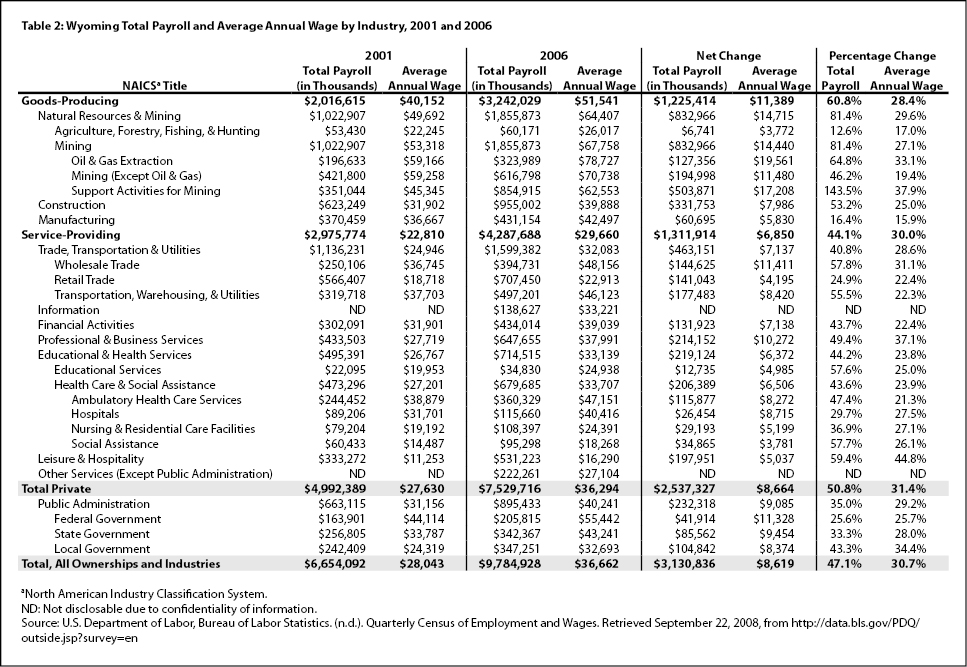
Total payroll and average annual wages by industry are shown in Table 2. While goods-producing industries experienced the largest percentage increase in total payroll compared to service-providing industries (60.8% compared to 44.1%), service-providing industries had a slightly higher percentage gain in average annual wage relative to goods-producing industries (30.0% compared to 28.4%).
Total payroll for natural resources & mining rose 81.4%, most of which was the result of payroll gains in mining. Within mining, total payroll for support activities for mining rose substantially. Total payroll more than doubled in support activities for mining, from $351 million in 2001 to $854.9 million in 2006, a gain of $503,871 (143.5%). Among service-providing industries, the largest percentage gain in total payroll was in leisure & hospitality, up 59.4% from 2001 to 2006.
Average annual wage percentage increases for leisure & hospitality were the highest among all industries. The average annual wage for leisure & hospitality rose from $11,253 in 2001 to $16,290 in 2006 (44.8%). Over the same period, support activities for mining had the second largest percentage increase in the average annual wage, from $45,345 to $62,553 (37.9%).
Total payroll in health care & social assistance rose by $206.4 million (43.6%). Of the health care subsectors, total payroll in ambulatory health care services had the greatest percentage (47.4%) and net ($115.9 million) increases.
Although total payroll increased in health care & social assistance, gains in the average annual wage were more modest. Overall, the average annual wage in health care & social assistance rose by 23.9% ($6,506). While ambulatory health care services experienced the largest gain in total payroll, the average annual wage percentage increase in ambulatory health care services was the smallest among health care & social assistance subsectors (21.3%). The largest average annual wage increase was in hospitals (27.5%).
If current trends persist, it is possible that compensation (both total payroll and average annual wages) in health care & social assistance will continue to rise. Wages will likely increase in order to attract more entrants into health care fields as a result of the growing demand for health care services (Saulcy, 2008).
Projected Occupational Growth, 2006 and 2016
In this section projected occupational growth in Wyoming is evaluated from three perspectives:
- Largest net growth.
- Highest paying occupations, including comparisons with the federal poverty guideline for a family of four to help evaluate the quality of projected growth.
- Occupations based on the need for postsecondary education:
- Those that typically require postsecondary education.
- Occupations that typically do not require postsecondary education.
- A comparison of occupations based on instructional programs.
The purpose of these perspectives is to demonstrate how the projections may be evaluated on the basis of employment growth, wages, and education. These data can be used by policy makers, employers, individuals entering or re-entering the labor market, and other stakeholders to make informed decisions.
Many additional occupations are shown in Appendix Tables 1 through 5, which may be copied and pasted into an Excel spreadsheet and are available at http://doe.state.wy.us/LMI/occ_proj_06_16/notes.htm.
Overall Growth
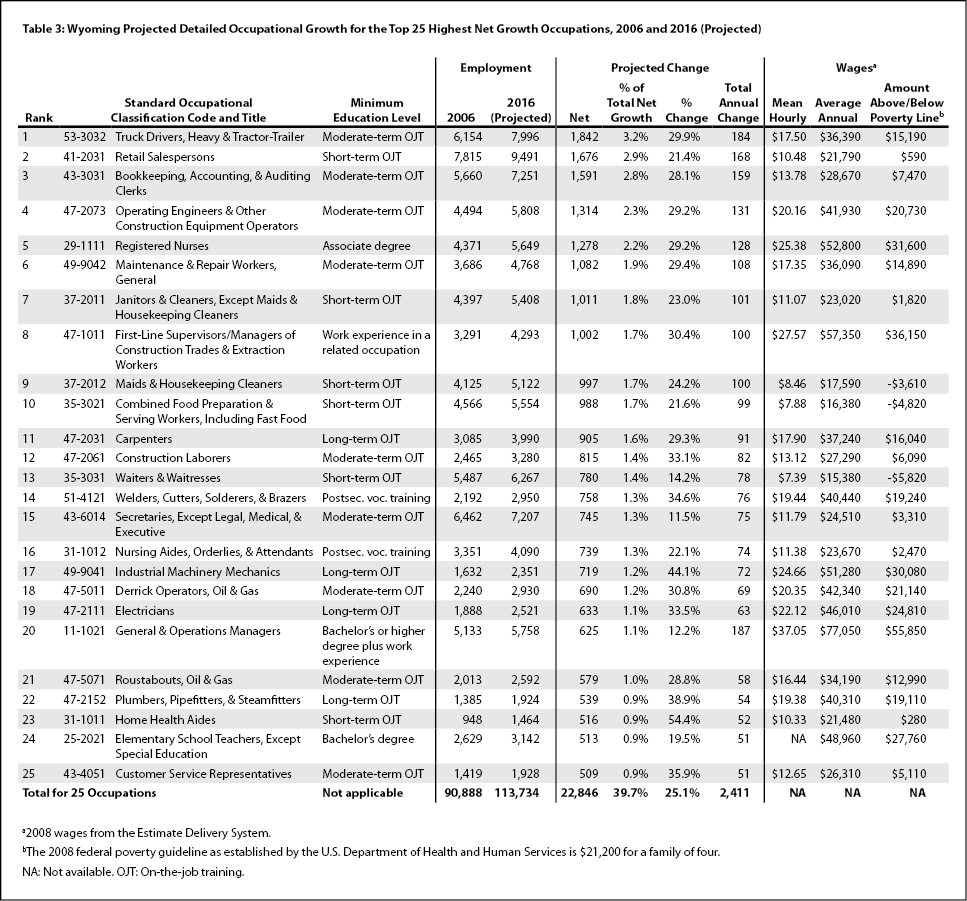
Of the 729 unique occupations, the top 25 occupations with the greatest net growth account for nearly 40% of total growth (see Table 3). The top 25 occupations are projected to add 22,846 of the 57,557 jobs (39.7%) from 2006 to 2016.
Heavy & tractor-trailer truck drivers are projected to have the highest net growth of all detailed occupations. The occupation is projected to add 184 jobs annually, while net growth in the occupation is projected to be 1,842 (29.9%). Among construction & extraction occupations, the highest projected net growth is for operating engineers & other construction equipment operators (1,314; 29.2%). Job duties for this occupation may include bulldozer, backhoe, and grader operation. This occupation is projected to increase by 131 jobs annually. In fact, 8 construction & extraction occupations are in the top 25 for net growth. The only occupation appearing in the top 25 from healthcare practitioner & technical occupations is registered nurses, which is projected to gain 1,278 jobs (29.2%). Jobs for registered nurses will grow by approximately 128 annually.
Table 4 shows projected occupational growth for the 25 occupations with the highest average annual wages. While few health care occupations are represented in the top 25 for net employment increases, 11 of the top 25 highest paying occupations are in health care. In fact, the eight highest paying occupations are in health care.
The decision of which occupation or career to pursue is, in part, a question of whether to train for a high-paying occupation with fewer projected employment opportunities or enter a lower-paying occupation with greater expected net job growth. This distinction is explored in the next section.
Education and Occupational Growth
Tables 5 and 6 show projected net occupational growth based on minimum education or experience requirements. Table 5 ranks in descending order the 25 occupations with the highest projected net growth that also typically require postsecondary education. In comparison, Table 6 ranks net occupational growth in descending order for the 25 occupations with the highest projected net growth that ordinarily do not require postsecondary education. Net growth among the top 25 highest growth occupations requiring postsecondary education is highest for registered nurses (1,278 jobs). The projected total annual change is nearly 60% greater for registered nurses than for the next occupation, welders, cutters, solderers, & brazers (128 compared to 76 annually).
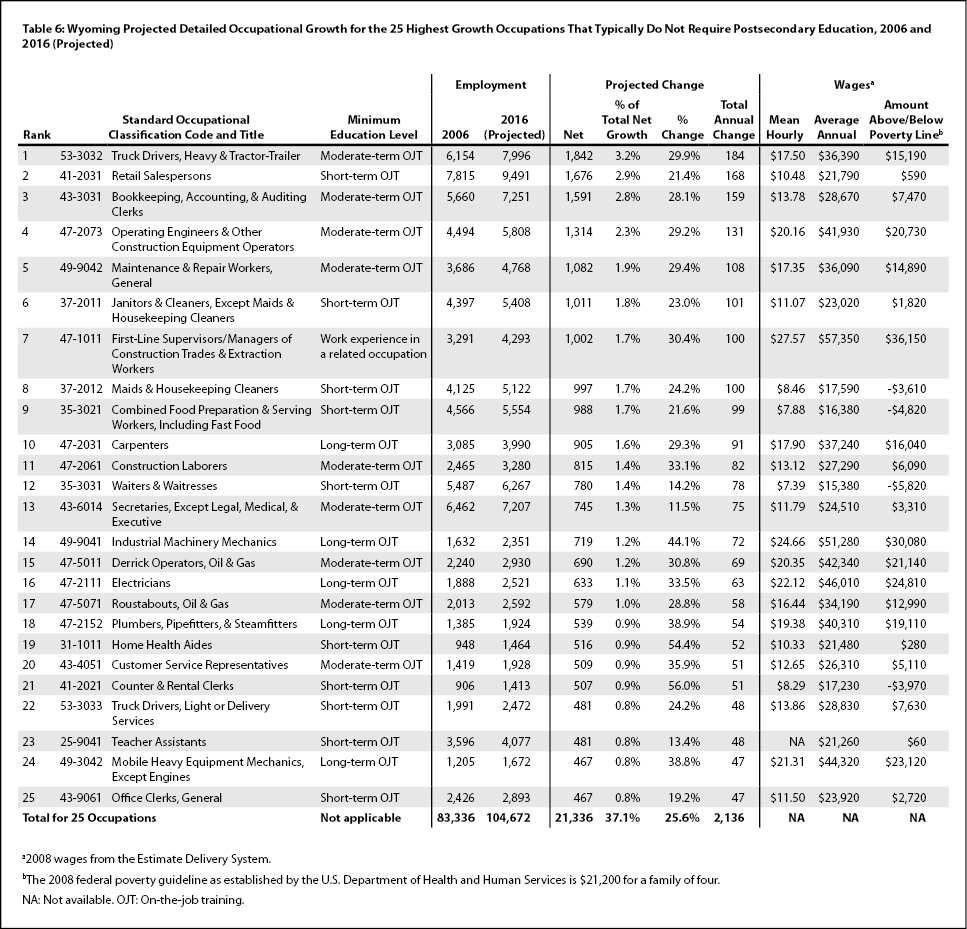
For occupations that typically do not require postsecondary education, net growth is projected to be highest for heavy & tractor-trailer truck drivers (1,842 jobs). As noted earlier, this occupation is also projected to have the highest net growth overall. The occupation with the next highest projected net growth is retail salespersons (1,676 jobs). In Table 6, wages range from $15,380 for waiters & waitresses to $57,350 for first-line supervisors/managers of construction trades & extraction workers.
While occupational growth is lower for occupations requiring at least postsecondary vocational training than for occupations that generally do not require it (14.1% of net growth versus 37.1%), wages are higher for these occupations. The highest net growth is for registered nurses, with an average annual wage of $52,800. Of the 25 occupations with the highest projected net growth that also typically require postsecondary education, pharmacists earn the highest wages ($91,320).
Growth and the Federal Poverty Guideline
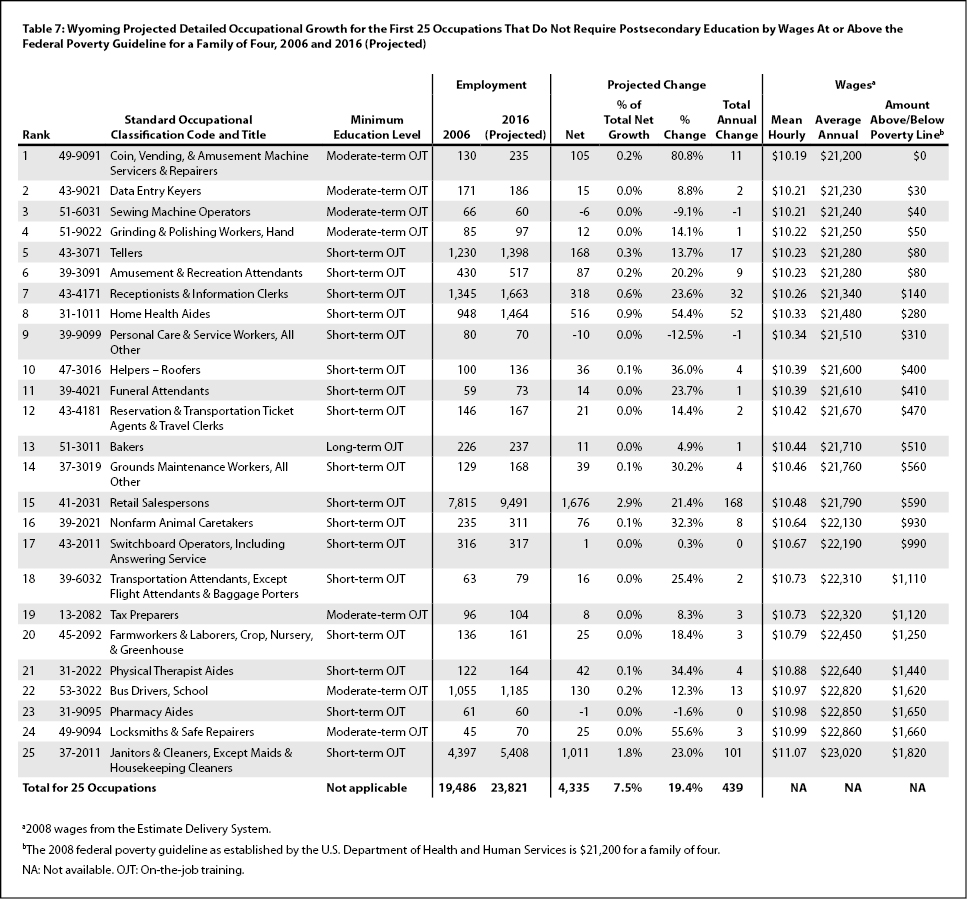
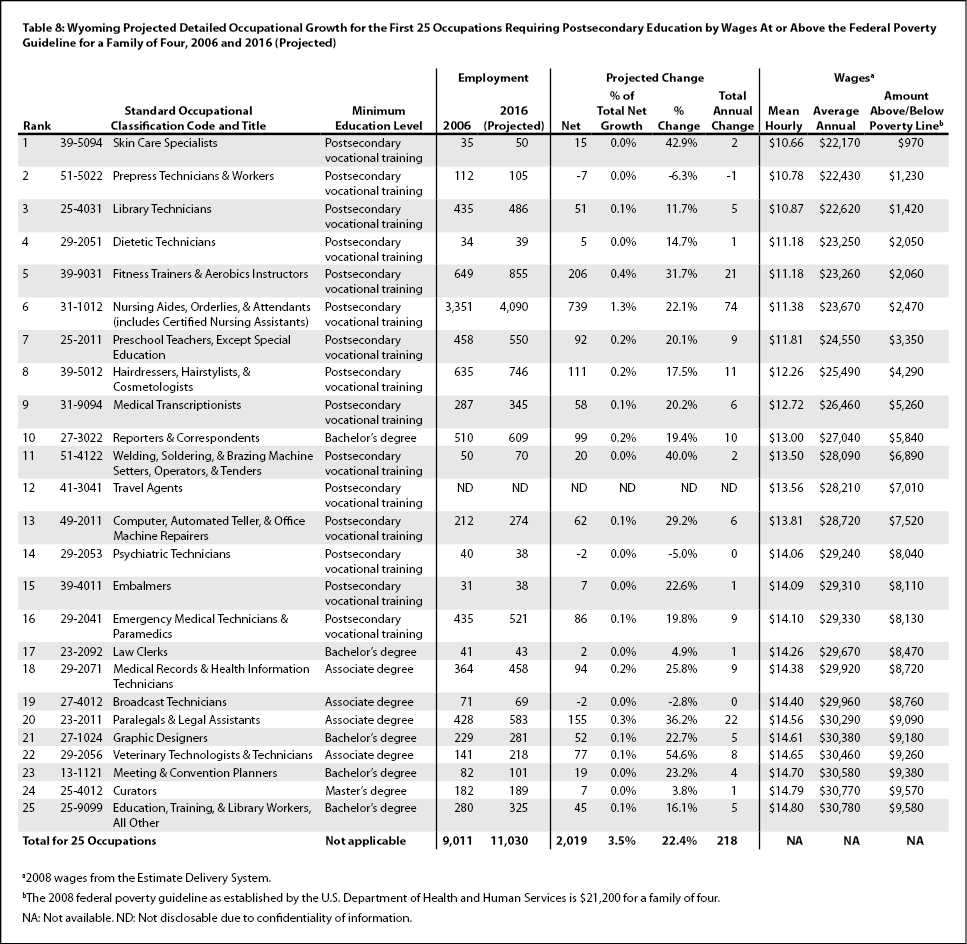
Tables 7 and 8 list occupations with wages at or above the federal poverty guideline, with education differentiating the two. Table 7 shows in ascending order by wages the first 25 occupations that pay at least the federal poverty guideline for a family of four and do not require postsecondary education. In comparison, Table 8 shows in ascending order the first 25 occupations that pay at or above the federal poverty guideline with minimum requirements of at least postsecondary vocational training. In 2008 the federal poverty guideline as established by the U.S. Department of Health and Human Services for a family of four was $21,200 (U.S. Department of Health and Human Services, 2008).
The occupations listed in Table 7 are projected to yield 7.5% of total net employment growth. Wages range from $0 to $1,820 above the federal poverty guideline. Wide variations are seen in the projected number of jobs. The occupation of all other personal care & service workers is expected to lose 10 jobs, while a gain of 1,676 is projected for retail salespersons.
The first 25 occupations that pay at or above the federal poverty guideline and require postsecondary education are projected to grow by 22.4% (see Table 8), whereas occupations not requiring postsecondary education are projected to increase by 19.4%. The range of wages above the federal poverty guideline for the top 25 occupations requiring postsecondary vocational training is substantially higher than for those that do not. For occupations that require postsecondary education, wages range from $970 to $9,580 above the poverty guideline. Comparing the two tables illustrates that education raises the average annual wage considerably. However, the net growth for the 25 occupations requiring at least postsecondary vocational training is approximately half of the growth for occupations that typically do not require postsecondary education.
Occupation and Education Program
While it is useful to consider education and training required for a particular occupation in general terms, the view is incomplete. Growth in the various occupations relies on experience or education in a wide range of fields. To demonstrate, Classification of Instructional Programs (CIP) categories are examined in conjunction with the related education level and occupations related to the field of study.
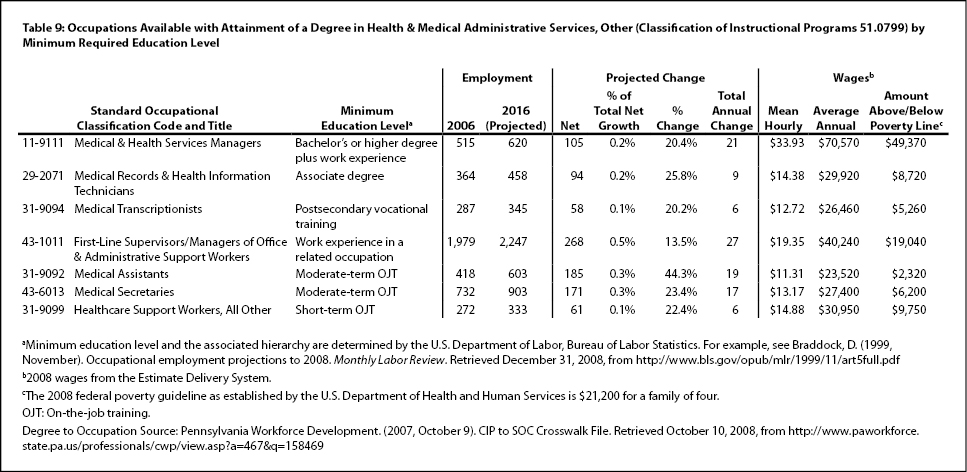
Table 9 shows the typical occupations available for graduates with a degree in other health & medical administrative services. Also included are the minimum education level required, projected employment growth, and wages. Of the seven occupations shown, the highest net growth is projected for first-line supervisors/managers of office & administrative support workers (268 jobs). The minimum education level for the occupation is work experience in a related occupation, with average wages paying $19,040 above the poverty guideline.
The highest paying occupation, medical & health services managers, pays $49,370 above the poverty guideline. Minimum education requirements are a bachelor’s degree or higher plus work experience. However, projected net job growth for medical & health services managers is approximately 40% less than for first-line supervisors/managers of office & administrative support workers (105 compared to 268).
With two exceptions, the table illustrates the progression of wages for various education and training levels alone. A bachelor’s or higher degree plus work experience is the highest education level while short-term on-the-job training is the lowest level. The highest education level corresponds to the highest paying occupation, medical & health services managers; the lowest education level is for all other healthcare support workers.
The two exceptions for the educational order are all other healthcare support workers and first-line supervisors/managers of office & administrative support workers. Although all other healthcare support workers has the lowest minimum education level, the average wages for the occupation are higher than for medical assistants, which requires moderate-term on-the-job training. The other exception, first-line supervisors/managers of office & administrative support workers, requires a minimum of work experience in a related occupation. Yet wages for this supervisory occupation are higher than for those with minimum educational requirements of postsecondary vocational training (medical transcriptionists) or an associate’s degree (medical records & health information technicians).
Various factors may influence the compensation received for a given education level. First, because all other healthcare support workers is a residual occupation, the nature of the work performed is unclear, except that it relates to health care. The occupations included in the residual category may be new or emerging and not sufficiently distinct to warrant separate classification. The average wage for this residual occupation is greater than for all but two of the occupations shown in Table 9. In addition, because of the new or emerging status, there may be only a few workers employed in all other healthcare support workers; consequently, limited useful information may be available (Hecker, Pikulinski, & Saunders, 2001). Also, to some degree, the minimum education level is subjective. Some employers view experience as more important than education, while others consider education as the more valuable human capital asset (Chapman, 2003). This element of subjectivity may help explain, in part, why first-line supervisors/managers of office & administrative support workers earn more on average than either medical transcriptionists or medical records & health information technicians, despite higher minimum education requirements for the latter two occupations.
Table 10 shows the occupations available to workers with varying levels of education in physical education teaching & coaching. Compare fitness trainers & aerobics instructors with postsecondary recreation & fitness studies teachers. The former occupation typically requires postsecondary vocational training, while the latter typically requires a master’s degree. Although the number of jobs for fitness trainers & aerobics instructors is projected to grow by 206, the average annual wage was less than half of the wages for postsecondary recreation & fitness studies teachers, which is projected to have the lowest net growth of the five occupations in Table 10 (nine jobs). The average annual wage for fitness trainers & aerobics instructors is $23,260. In contrast, recreation & fitness studies teachers, postsecondary earn an average annual wage of $56,730.
As Tables 9 and 10 demonstrate, the reward for additional education or experience is higher wages. However, this is not always true, as shown by the occupations in Table 9. Despite the exceptions, however, education usually pays off. The National Center for Education Statistics estimates that in 2006, young adults age 25 to 34 with a bachelor’s degree earned 28% more than those with an associate’s degree and 50% more than high school completers. On average, an associate’s degree translated to an average of $5,000 more per year than a high school diploma (Planty et al., 2008).
Projections: An Application
In early 2008, R&P received a request from Central Wyoming College to assist with a needs assessment for adding training programs associated with environmental health and safety occupations. R&P’s role was to provide information on projected total growth in these occupations. Twenty-nine occupations were determined to be relevant to environmental health and safety. It was estimated that the 29 occupations would grow by 2,094 jobs from 2007 to 2014. In addition, R&P estimated there would be 512 total annual openings resulting from both growth and replacement in environmental health and safety occupations in Wyoming. The largest number of annual openings is projected to occur for operating engineers & other construction equipment operators (169 annual openings; Gallagher et al., 2008).
Based on this research, Central Wyoming College determined that there was sufficient demand for environmental health and safety occupations to create training programs to meet the knowledge, skills, and abilities required (L. McAuliffe, Assistant Dean of Workforce and Community Education, Central Wyoming College, personal communication, December 10, 2008). The use of R&P research by Central Wyoming College demonstrates how projections can be applied with tangible outcomes resulting from the analysis.
Summary
Wyoming’s economic fortunes are strongly linked to natural resources extraction. Workers preparing to enter the labor market or considering a career change should decide whether to enter an occupation with higher wages but potentially lower job growth, or one with stronger job prospects but possibly lower wages. Given the volatility of economies that rely on natural resources (Cuddington & Liang, 2003), the best course of action for those who seek to stay in Wyoming long-term would be to acquire training or experience for occupations in which the skills can be transferred to a range of industries and occupations. Occupations that provide goods and services (and, specifically, health care) to an increasingly older population likely will provide solid employment options regardless of economic conditions.
In addition to the tables included in this report, five tables available online include occupations not discussed here. These tables, which may be pasted into an Excel spreadsheet and sorted in a variety of ways, are available at http://doe.state.wy.us/LMI/occ_proj_06_16/notes.htm.
References
Bullard, D., & Leonard, D.W. (2008, April). Wyoming statewide long-term employment projections 2006-2016. Retrieved November 25, 2008, from http://doe.state.wy.us/LMI/lt_ind_rollups_06_16.pdf
Census Bureau, U.S. Department of Commerce. (2005). Interim projections of the population by selected age groups for the United States and states: April 1, 2000, to July 1, 2030. Retrieved November 12, 2008, from http://www.census.gov/population/projections/SummaryTabB1.xls
Chapman, R. (2003, October 28). Don’t fear the exodus: Paying for IT staff to get qualified is a worthwhile investment. Computer Weekly. Retrieved December 31, 2008, from http://proxy.lib.wy.us/login?url=http://search.ebscohost.com/login.
aspx?direct=true&db=f5h&AN=11532419&site=ehost-live&scope=siteCuddington, J.T., & Liang, H. (2003, March 10). Commodity price volatility across exchange rate regimes [working paper]. Retrieved October 10, 2008, from http://www.mines.edu/fs_home/jcudding/papers/Comm_Price_Volatility/Cuddington-
Liang-Commodity%20Price%20Volatility(03.10.2003).pdf
Ellsworth, P., & Saulcy, S. (2008, January). Projections for industries & occupations in Wyoming, 2004-2014. Retrieved September 11, 2008, from http://doe.state.wy.us/LMI/projections_08_14.pdf
Gallagher, T. (2003, April). Chapter 1. Economic assumptions and the use of projections data. In T. Gallagher, M. Harris, D.W. Leonard, W. Lieu, & B. McVeigh, Employment outlook: 2010. Retrieved September 11, 2008, from http://www.doe.state.wy.us/LMI/EmpOutlook2010.pdf
Gallagher, T., Harris, M.A., Hauf, D., Jones, S.D., Leonard, D.W., & Szuch, A. (2008, June 5). Occupational information for environmental health & safety programs: Industry demand, wages, and skills. Retrieved December 9, 2008, from http://doe.state.wy.us/LMI/CWC_report_web.pdf
Harris, M. (2004, February). Chapter 1. Occupational projections – a decision making tool. In T. Glover, M. Harris, & S. Saulcy, Occupational outlook: 2010 (pp. 1-5). Retrieved September 11, 2008, from http://doe.state.wy.us/LMI/OccOutlook2010/
Occ%20Outlook%202010%20pub.pdfHecker, D., Pikulinski, J.R., & Saunders, N.C. (2001). Chapter 3: Economic change and structures of classification. In M. Gabor, D. Houlder, & M. Carpio (Eds.), Report on the American workforce (pp. 95-116). Retrieved December 31, 2008, from http://www.bls.gov/opub/rtaw/pdf/rtaw2001.pdf
Leonard, D.W. (2008, March). Chapter 2: Projections of registered nurses needed to 2014. In P. Ellsworth & A. Szuch (Eds.), Nurses in demand: A statement of the problem (pp. 2.1-2.13). Retrieved November 24, 2008, from http://doe.state.wy.us/LMI/nursing_demand_08.pdf
Planty, M., Hussar, W., Snyder, T., Provasni, S., Kena, G., Dinkes, R., KewalRamani, A., & Kemp, J. (2008). The condition of education 2008 (p. 30). National Center for Education Statistics, Institute of Education Sciences, U.S. Department of Education. Retrieved December 31, 2008, from http://nces.ed.gov/pubs2008/2008031.pdf
Saulcy, S. (2008, March). Chapter 1: U.S. and Wyoming demographic profile. In P. Ellsworth & A. Szuch (Eds.), Nurses in demand: A statement of the problem (pp. 1.1-1.12). Retrieved December 31, 2008, from http://doe.state.wy.us/LMI/nursing_demand_08.pdf
U.S. Department of Education. (2002, May 8). Classification of Instructional Programs: 2000 edition. Retrieved November 24, 2008, from http://nces.ed.gov/pubsearch/pubsinfo.asp?pubid=2002165
U.S. Department of Health and Human Services. (2008, January 23). The 2008 HHS poverty guidelines. Retrieved September 29, 2008, from http://aspe.hhs.gov/poverty/08poverty.shtml
U.S. Department of Labor, Bureau of Labor Statistics. (2004, December 2). Standard Occupational Classification (SOC) user guide. Retrieved November 24, 2008, from http://stats.bls.gov/soc/socguide.htm