
Chapter 3: Workforce Turnover & Continuous Employment: The Importance of the Distribution of Age & Gender
This chapter provides an explanation for the labor market behavior of individuals in different age groups, with a focus on young adults. The majority of young adults between the ages of 19 and 24 are faced with important life events, such as college, employment, marriage, and birth of a first child. Based on evidence from the Wage Records administrative dataset, young adults tend to work in different industries than older adults. Also, job turnover is much higher for younger workers, and continuously employed males generally earn higher average wages than females, except in the educational & health services industry. Males in Wyoming find continuous employment largely in mining, construction, retail & wholesale trade, and educational & health services, while females find continuous employment primarily in educational & health services, leisure & hospitality, and retail & wholesale trade.
Literature Review
Many important life decisions regarding education, employment, marriage, and children are made between the ages of 19 and 24 (Harris, 2015). Harris noted that 55.4% of females and 49.5% of males in Wyoming marry while in this age group, and that 53.9% of females and 43.3% of males in Wyoming have their first child. In addition, an increasing number of Wyoming’s youth are finding employment in other states.
Evans (1999) found that turnover rates are greater in industries that offer lower wages and require fewer job skills. For example, retail trade has one of the highest turnover rates of all industries. Toups (1999) found that 32.2% of youth between the ages of 18-20 were employed in the lowest paying jobs in retail trade, possibly building their skill sets. Females ages 18 to 20 were employed mainly in retail trade and services, while males tended to be employed in a wider array of industries including retail trade and services, construction, manufacturing, and mining (Toups, 1999).
Moore (2015) noted that both educators and policymakers recognize the importance of understanding the labor market choices of youth after high school. Moore found that 58.5% of Wyoming’s senior class of 2010 did not enroll in postsecondary education, and by 2013, 59.1% were found working in Wyoming and 8.9% were found working in a partner state. The 2013 median and mean wages for the class of 2010 were higher in Wyoming compared to partner states. Moore suggested that individuals may be moving for family reasons or to pursue educational opportunities, instead of for higher wages.
Methodology and Definitions
Box 3.1: Turnover Definitions
Hire
An individual who was not employed the prior quarter and was recently hired into an industry.
Exit
An individual who left employment in an industry who worked at least one prior quarter.
Both
An individual who was hired and exited an industry in the same quarter.
Continuous
Individuals who were found with the same employer in the prior, reference, and subsequent quarters.
Non-Continuous
The sum of individuals categorized as hire, both, and exit.
Turnover Rate
Hires + Exits + Both
divided by
Total (Hires + Exits + Both + Continuous)
Data for this chapter come from Wyoming’s wage records and from 11 partner states with which Research & Planning (R&P) has data sharing agreements: Alaska, Colorado, Idaho, Montana, Nebraska, New Mexico, Ohio, Oklahoma, South Dakota, Texas, and Utah.
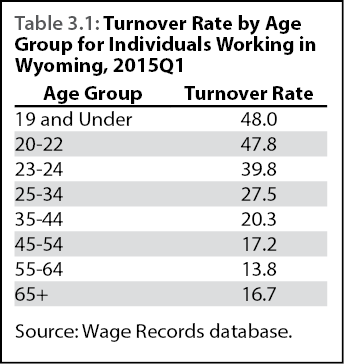
The turnover rate, explained in Box 3.1, is a key indicator of labor market activity, and was defined by Glover in 2003. Turnover is calculated as the percentage of individuals who maintain a job during a given time period, as compared to all workers, including those who begin and/or end work with an employer. For example, in first quarter 2015 (2015Q1) those ages 19 and under had an average turnover rate of 48.0%, which means that in 48.0% of workers ages 19 and under either began working for an employer, ceased working for an employer, or possibly both. Correspondingly, 52.0% of workers 19 and under had a connection with their employer before, during, and after 2015Q1. Wyoming’s method for calculating workforce turnover data has been emulated by partner states, and more information regarding Wyoming’s historical turnover data can be found at http://doe.state.wy.us/LMI/turnover.htm.
This chapter focuses on data from 2015Q1, with a focus on those 19 and under, 20-22, and 23-24 (see Box 3.2). Analyses for all other age groups can be found online at http://doe.state.wy.us/LMI. Results are reported as a total and by gender, as the industries in which people work and their corresponding job stability vary between males and females. Weighted averages were used for total wages, meaning a greater emphasis was placed on the average wage where more individuals were employed in an industry.
Industrial categories follow the U.S. Census Bureau’s North American Industry Classification System manual. Goods-producing industries include agriculture, forestry, fishing, & hunting; mining; construction; and manufacturing. Other industries are considered service providing. In agriculture, forestry, fishing, & hunting, individuals were excluded from analysis if wages were three standard deviations above the mean.
Employment, wage, and turnover data discussed in this chapter were taken from large, detailed tables, which are available here.
Box 3.2: Age Groups
19 and under
Includes students in high school and post high school individuals seeking to enter the workforce or enroll in postsecondary education.
20-22
Includes those who have entered the workforce following high school, are working while enrolled in postsecondary education, or have obtained a certificate or degree from a postsecondary institution and found employment.
23-24
Includes those finishing up their bachelor’s degrees and entering the workforce or working to complete a master’s degree.
25-34
Includes those transitioning by completing an advanced degree program or have already transitioned into the workforce.
35-44
Those employed in a job.
45-54
The experience added while employed in a job.
55-64
Those preparing for retirement.
65+
Those who are still employed or retired.
Total
Individuals ages 19 and younger work primarily in leisure & hospitality, wholesale & retail trade, transportation, utilities & warehousing, and educational & health services. Youth in these industries may be working low wage jobs and developing the necessary skills as they age to transition into a job within any industry, and they may be going to school. Males are more likely than females to work in goods-producing sectors; males made up 89.5% of the goods producing workforce for ages 20-22 in 2015Q1, while females made up 56.4% of service-providing employment.
|
The turnover rate decreases considerably as age increases. In 2015Q1, those ages 19 and under had an average turnover rate of 48.0% (see Table 3.1), whereas the turnover rate for those ages 23-24 was 39.8%. The 55-64 age group had the lowest turnover rate, but for those ages 65 and older, the average turnover rate was higher. Retirees may have decided to re-enter the workforce part-time to stay busy or increase their supplemental income in seasonal industries, which could explain the increase in the turnover rate.
|
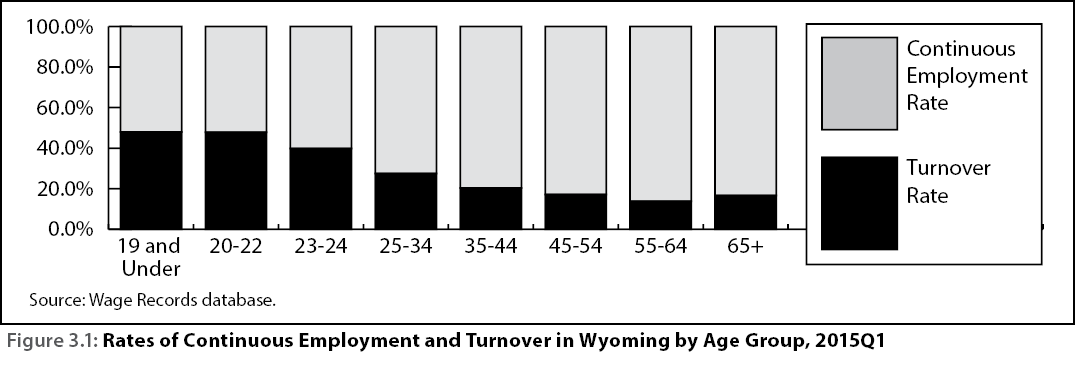
Figure 3.1 shows correlations between age and turnover. There are multiple explanations for this trend. Young adults may job hop as they find a position suitable to their interests, or they may use accumulated experience as leverage for better employment opportunities. As individuals age, they may settle into a career, or a worker’s value may increase with time and experience, leading to higher wages and therefore increasing a worker’s incentive to maintain their connection with their employer.
Females
Female employment is concentrated in the service-providing sectors. For those ages 19 and under, 82.3% of continuous employment is concentrated in leisure & hospitality; wholesale & retail trade; transportation, utilities, & warehousing; and educational & health services. These three industries employed the greatest number of females in each age group until employment in public administration surpassed employment in leisure & hospitality in the 45-54 and 55-64 age groups. Educational & health services accounts for 13.4% of continuous employment for females ages 19 and under, but it accounts for 41.1% of continuous employment in the 25-34 age group. Females may have entered the educational & health services field as they graduated from certificate and degree programs.
In 2015Q1, 47.0% of females in the workforce ages 19 and under gained, lost, or changed jobs. The turnover rate for this quarter decreased in every age group until it reached a low of 12.6% for females ages 55-64. Turnover for females is generally slightly lower than it is for males.
Average quarterly wage for the youngest continuously employed females, those ages 19 and under, was $1,809 in 2015Q1. The average quarterly wages for females ages 20-22 was more than double the wages for those ages 19 and under ($3,768). Females ages 23-24 earned an average of $5,219 per quarter. Wages for females peaked at $9,946 per quarter in the 45-55 age group. The steep increases for young adults may be a result of a rapid gain in human capital and completion of degrees and certificates.
Males
While males ages 19 and under with continuous employment worked primarily in leisure & hospitality; wholesale & retail trade; transportation, utilities, & warehousing; and educational & health services, the concentration of males in this age group working in the goods-producing sector (11.7%) was approximately five times the concentration of females. In the 20-22 age group, 28.8% of males worked in the goods-producing industries; this figure peaks at 38.3% in the 35-44 age group. Younger males seem to begin their careers in very similar industries as females, but diversify into mining, construction, and professional and business services as they age.
In the 19 and under age group, the turnover rate was 49.1% and reached a low of 14.9% for the 55-64 age group. The seasonality of goods-producing jobs may contribute to the relatively higher turnover rate for males.
The average quarterly earnings for males were higher than those for females in every age group and the gap initially widened as they got older. Males ages 55-64 earned the most of any age group, on average, with $17,952 per quarter. For each age group, males working in mining earned the highest average wages.
Discussion
As previously mentioned, males are more likely than females to be employed in goods-producing industries, which include agriculture, forestry, fishing, & hunting; mining; construction; and manufacturing. Females were more likely to be employed in the service-providing sector, primarily in educational & health services; trade, transportation, & utilities; leisure & hospitality; and public administration. In nearly every industry, for every age group, males made more on average than females, with the exception of young adults ages 24 and younger in the educational & health services field.
Several limitations are apparent. R&P compared 15 female entrants in the mining industry to 186 males, and 286 females in educational & hospitality to 75 males. The low number of entrants for each example above cannot show statistical significance. Another limitation included not comparing occupational data across gender and age. Occupational data within industries are a smaller unit than industry data and would be insightful in explaining questions regarding wage gaps between gender and age because R&P can compare wages between genders with similar time on the job.
Future studies should gravitate towards occupational research. Occupational data represent the smallest unit measurable and provide information on specific occupations that are in demand across industries. With occupational data available, questions regarding the gender wage gap in Wyoming can be better answered. A possible study on the gender wage gap would involve analyzing occupational data annually within industries by comparing the wages of all general practitioners, or all neurological surgeons separately by gender and other variables would be appropriate. Educational data provides insight into Wyoming’s labor market by analyzing graduates and their fields of study who stay or leave the state. Further, educational data coupled with wage records would provide an explanation of the effect of education on wages.
References
Evans, M. (1999). Job turnover and hire rates in Wyoming. Wyoming Labor Force Trends, 36(6). Retrieved February 23, 2016 from http://doe.state.wy.us/LMI/0699/a1.htm
Glover, T. (2000). The instability index as a measure of labor market activity. Wyoming Labor Force Trends, 37(3). Retrieved February 23, 2016 from http://doe.state.wy.us/LMI/0300/a3.htm
Glover, T. (2003). An introduction to the wage records applications. Retrieved February 23, 2016 from http://doe.state.wy.us/LMI/staff/WRAP.pdf
Harris, P. (2015). Youth transitions: Life events and labor market behavior. Wyoming Labor Force Trends, 52(5). Retrieved February 23, 2016 from http://doe.state.wy.us/LMI/trends/0515/a1.htm
Moore, M. (2015). WE connect: Employment, earnings, and postsecondary enrollment of Wyoming high school students. Wyoming Labor Force Trends, 52(11). Retrieved February 23, 2016 from http://doe.state.wy.us/LMI/trends/1115/a1.htm
Toups, C. (1997). Work experiences of Wyoming’s youth. Wyoming Labor Force Trends, 34(7). Retrieved February 23, 2016 from http://doe.state.wy.us/LMI/0797/0797a1.htm