Survey Results
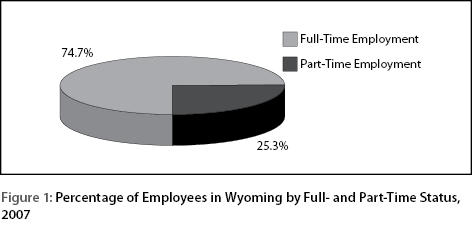
One of the best indicators of whether employees will be offered benefits is their status as either full-time or part-time. Figure 1 shows that in 2007, approximately three-quarters (74.7%) of employees in Wyoming were full-time and the remainder were part-time (25.3%) on a quarterly average basis.
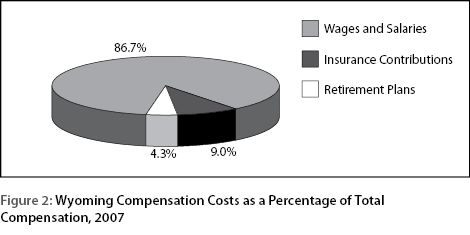
Insurance and retirement plans make up a significant portion of total compensation costs in Wyoming. An estimated 9.0% of total compensation is in the form of employer contributions to insurance premiums (see Figure 2). Additionally, 4.3% of compensation is employer contributions to retirement plans. These are the two costliest benefits to employers and much of the following discussion will focus on these two benefits.
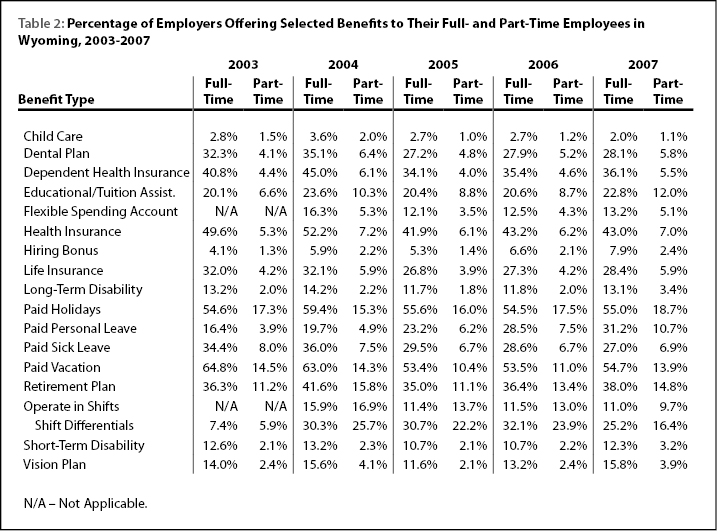
Table 2 shows the percentage of employers offering selected benefits from 2003 to 2007. In every category more employers offered benefits to their full-time employees than to part-time employees. In 2007, the benefit offered by the largest percentage of employers to full-time employees was paid holidays (55.0%). From 2005 to 2007 the percentage of employers offering this benefit stayed roughly constant. The second most common benefit offered to full-time employees in 2007 was paid vacation (54.7%). In 2007, 43.0% of employers offered their full-time employees health insurance and 7.0% of employers offered part-time employees health insurance. These proportions remained fairly similar from 2005 to 2007. The proportion of employers offering their full-time employees a retirement plan was 38.0% in 2007, a slight increase from 2005 and 2006.
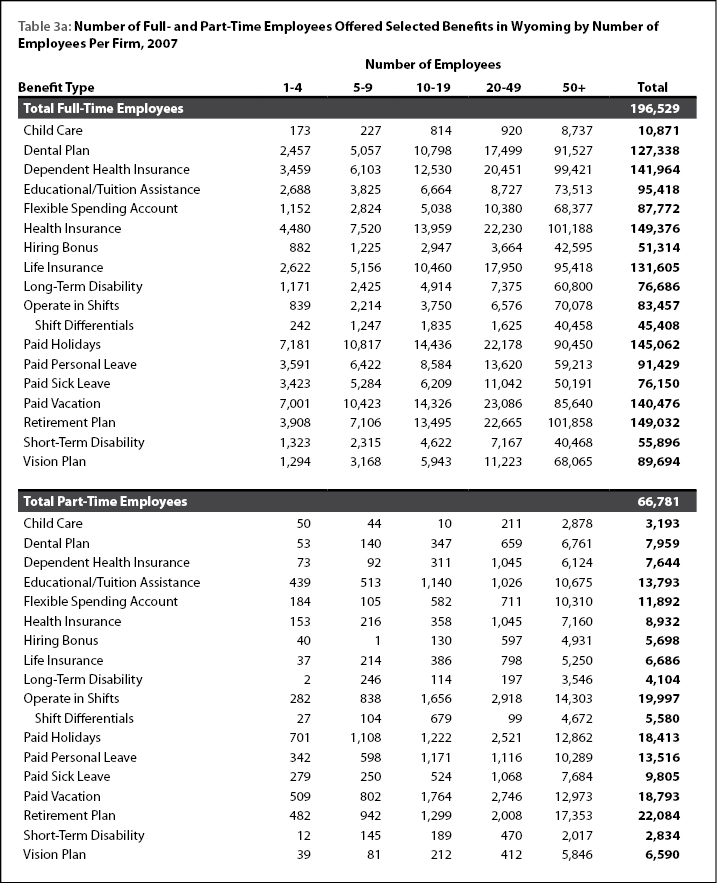
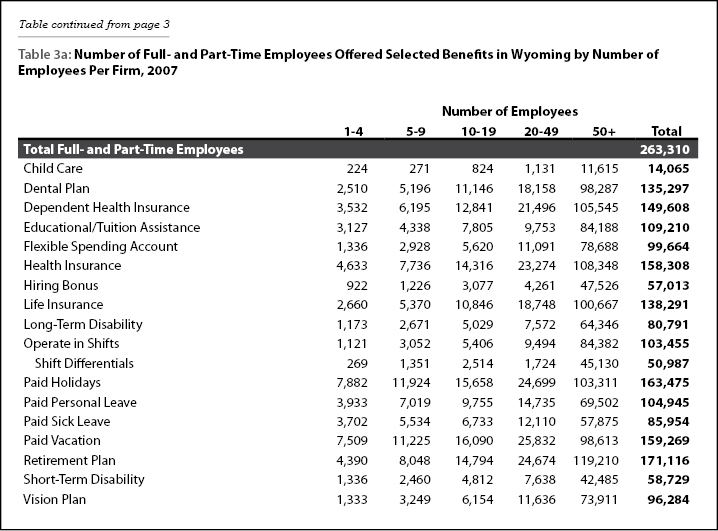
Table 3a shows the number of employees offered benefits in 2007 by the size of firm and by their full-time or part-time status. For full-time employees, the largest number offered benefits were those associated with large employers (50+ employees). For example, 101,188 full-time employees were offered health insurance through a large employer. An estimated 101,858 full-time employees were offered access to a retirement plan through a large employer. In contrast, for the smallest firms (1-4 employees) 4,480 full-time employees were offered health insurance and 3,908 were offered a retirement plan. As noted, there are often fixed costs for setting up and administering health insurance and retirement plans. In addition, some small firms in Wyoming are parts of larger national or multinational firms. Large employers can spread these costs across many employees, while small employers cannot.
Looking at part-time employees, a similar picture emerges. In most cases, the majority of part-time employees who were offered benefits worked for the largest employers. For example, of the 22,084 part-time employees who were offered a retirement plan, 17,353 worked for large firms.
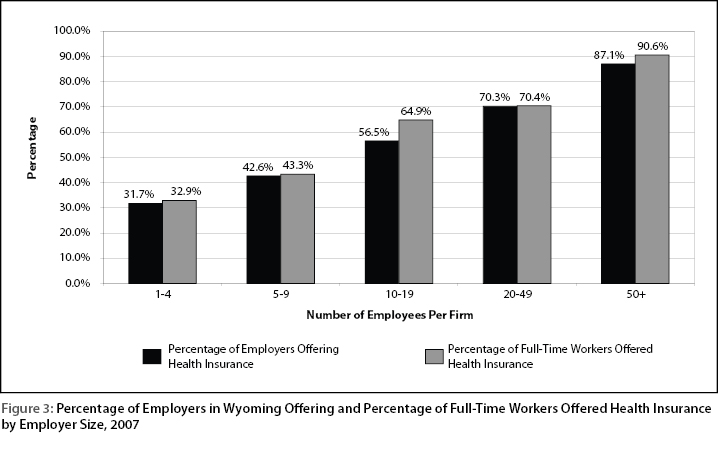
More than 9 of 10 (90.6%) full-time workers at large firms were offered health insurance (see Figure 3). Similarly, the percentage of large employers who offered health insurance to full-time employees (87.1%) was much higher than the percentage of small employers (31.7%).
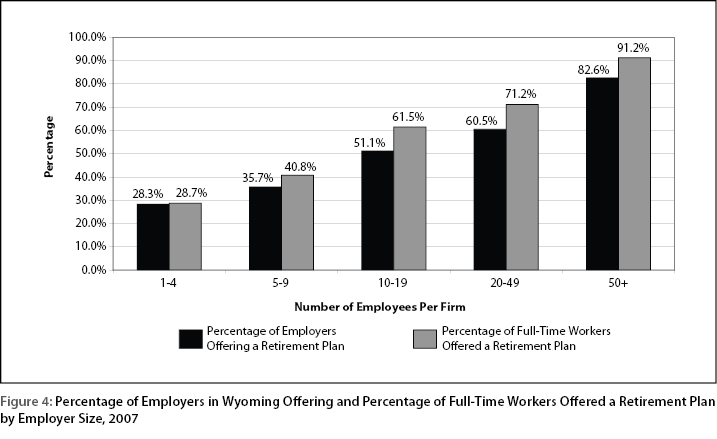
Figure 4 shows that as employer size increased, retirement plans became more common. The vast majority of full-time workers at large firms were offered access to a retirement plan (91.2%).
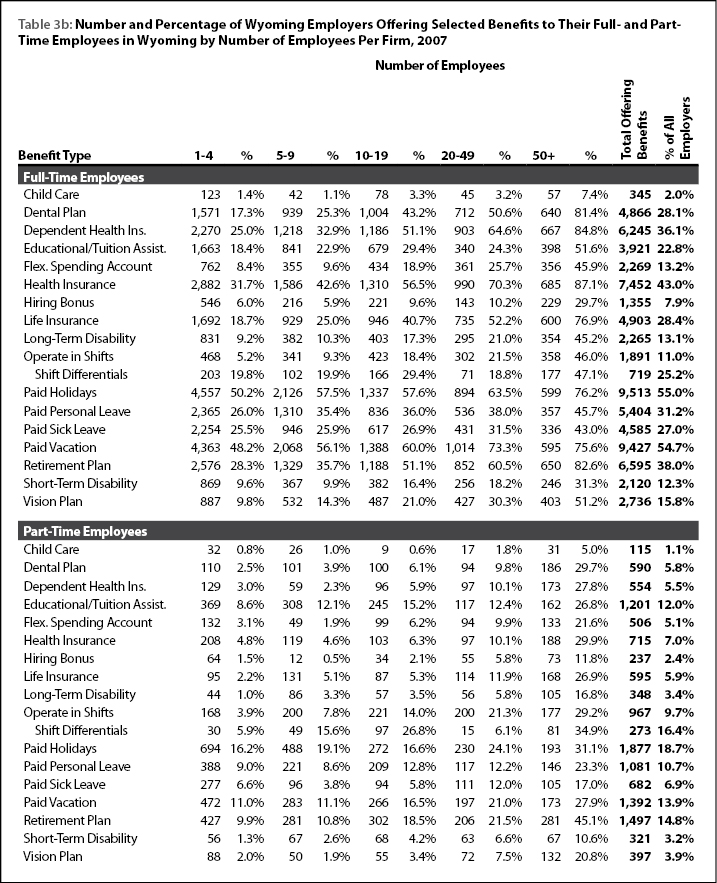
Table 3b shows large employers were more likely to offer benefits than small employers. One-quarter (25.0%) of the smallest employers offered dependent health insurance to full-time employees in 2007. This percentage steadily increased with employer size, so that more than half (51.1%) of employers with 10-19 employees offered this benefit and 84.8% of the largest employers offered it. The differences across firm size were not as large for paid vacation, but the pattern still held. Slightly fewer than half (48.2%) of the smallest firms offered paid vacation to full-time employees, and this grew to 75.6% of the largest firms.
For part-time employees of small employers, benefits were the exception rather than the rule. Only 3.0% of the smallest employers provided dependent health insurance to part-time employees. However, as employer size increased, the percentage of employers offering this benefit grew to 27.8%. The percentage of firms offering a retirement plan to their part-time employees ranged from 9.9% of the smallest employers (1-4 employees) to 45.1% of the largest employers (50+ employees).
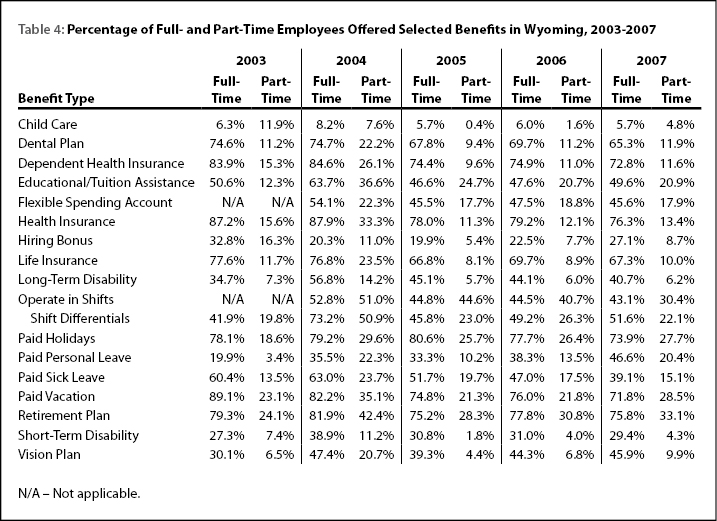
In 2007, full-time employees were more likely to be offered health insurance (76.3%) than any other benefit (see Table 4). The second most commonly offered benefit to full-time employees was a retirement plan (75.8%). The most frequently offered benefit to part-time employees in 2007 was a retirement plan (33.1%), followed by paid vacation (28.5%) and paid holidays (27.7%). Health insurance was offered to only 13.4% of part-time employees in 2007, perhaps because of its high cost.
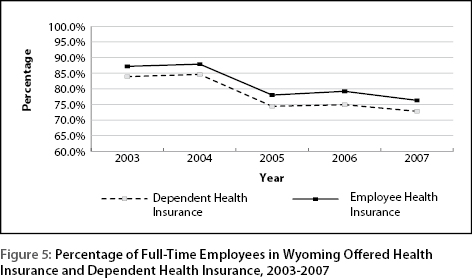
Table 4 also shows the trends over time in the percentage of employees offered benefits. It appears that the percentage of part-time employees offered a retirement plan has been steadily increasing over the past few years (up from 28.3% in 2005 to 33.1% in 2007). From 2006 to 2007 the percentage of full-time employees offered health insurance fell slightly (79.2% in 2006 to 76.3% in 2007), and the percentage offered dependent health insurance also fell (see Figure 5).
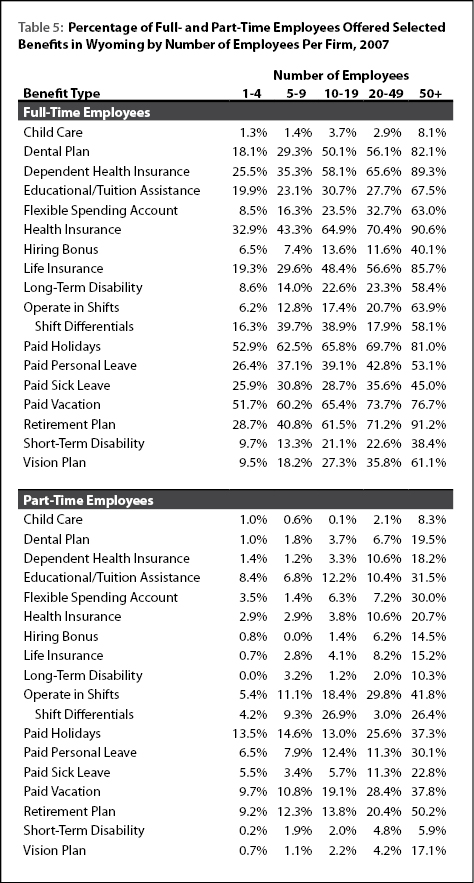
Full-time employees were most likely to be offered benefits by the largest employers (see Table 5). For some key benefits, such as health insurance and retirement plans, employees at large firms were roughly three times as likely to be offered the benefits than workers at the smallest firms. For health insurance coverage, the percentage of employees offered the benefit increased steadily with firm size from 32.9% at the smallest firms to 90.6% at the largest employers. Only 28.7% of full-time employees at the smallest firms were offered access to a retirement plan, compared to 91.2% of employees at the largest firms.
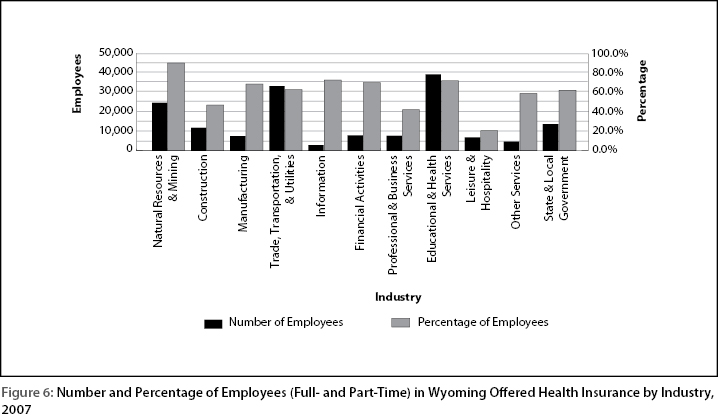
The number and percentage of employees offered benefits varied widely by industry (see Figure 6). Clearly some industries offered more generous benefits packages than others. The types of benefits offered by employers may reflect their types of workforce. For example, employers in highly seasonal industries such as construction or leisure & hospitality may be less likely to offer benefits to their employees. On the other hand, employers with stable workforces, such as state & local government and educational & health services, may provide their employees with comprehensive benefits packages. The relationship between turnover and benefits is not always simple. The relationship appears to be negative – when a firm offers benefits, turnover is likely to be lower. However, the relationship may be the result of confounding variables and may run in both directions. One firm may retain employees because of the benefits offered, while another firm might not offer benefits because of high turnover. For a detailed discussion of access to health benefits, see Gallagher, Harris, Hiatt, Leonard, Saulcy, and Shinkle (2005).
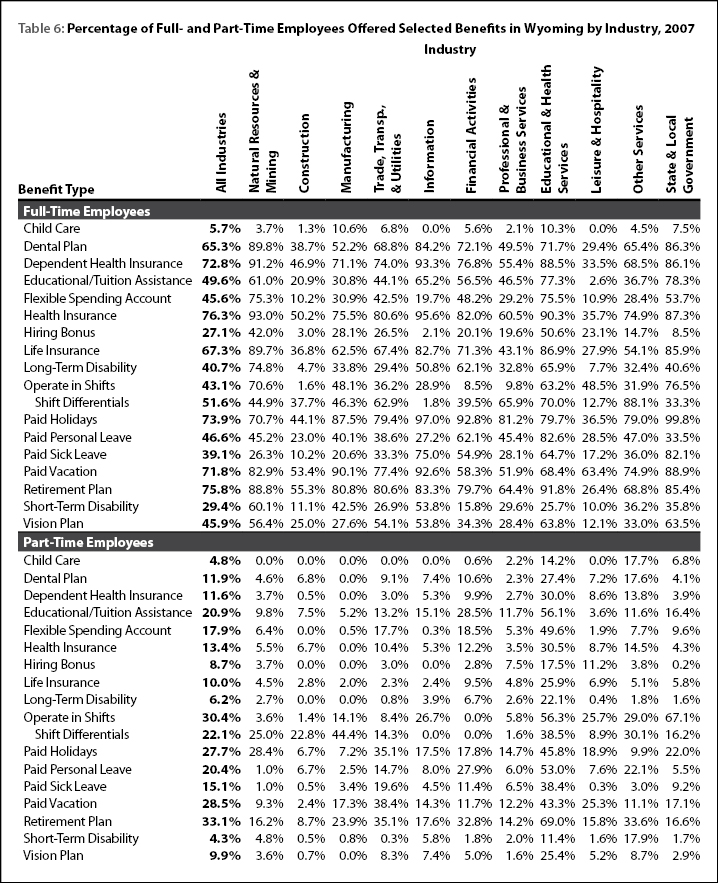
Full-time employees in natural resources & mining were more likely to receive benefits than the average for all industries (see Table 6). An estimated 93.0% of full-time employees in natural resources & mining were offered health insurance and 91.2% were offered dependent health insurance. Both of these proportions were much larger than the average across all industries (76.3% and 72.8%, respectively). Employers in natural resources & mining typically pay high wages, and may see offering better-than-average benefits packages as a cost-effective alternative to attract these in-demand workers.
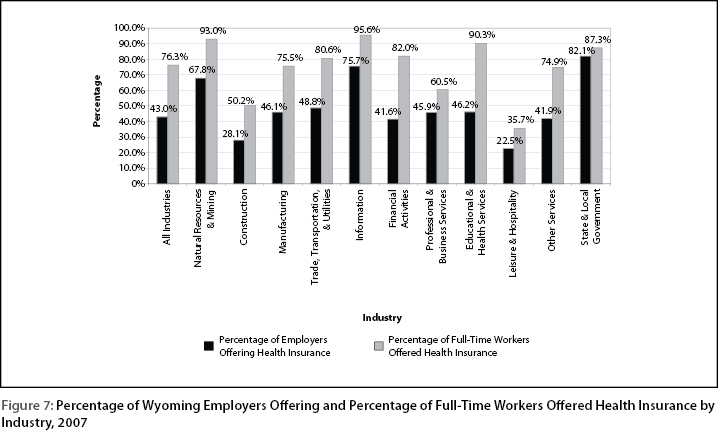
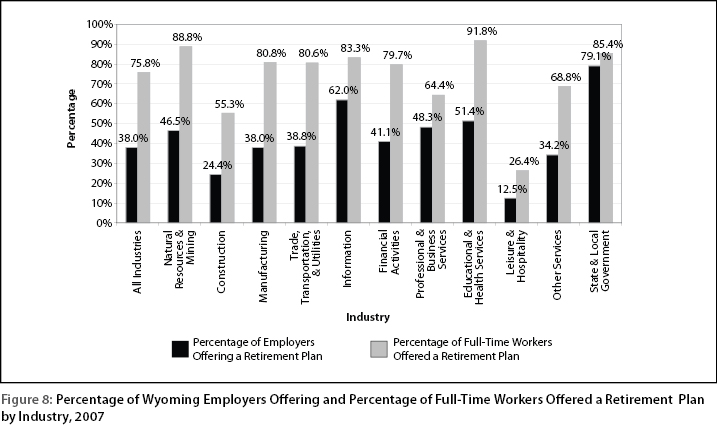
A much smaller proportion of employees in the construction sector received benefits than the statewide average. Slightly more than half (50.2%) of full-time employees in construction were offered health insurance, while 55.3% were offered a retirement plan (see Figures 7 and 8). These figures are approximately 20 percentage points lower than the average. In third and fourth quarter 2007, the construction sector had the second highest turnover rate of all major industries (51.4% and 49.7%, respectively; Leonard, 2008a, 2008b).
Manufacturing employees were more likely to receive access to a retirement plan than the average (80.8% compared to 75.8%). They were also more likely to receive paid holidays (87.5% compared to 73.9%). The percentages of full-time manufacturing employees receiving access to health insurance and dependent health insurance were similar to the statewide average (75.5% and 71.1%, respectively).
Trade, transportation, & utilities is a large industry that includes a variety of firms from retail stores to trucking companies to electric power plants. In 2007, full-time employees were more likely than average to be offered key benefits such as health insurance (80.6%), dependent health insurance (74.0%), and a retirement plan (80.6%).
Wyoming’s information industry is relatively small and stable. Full-time employees in this sector appeared most likely to receive access to many benefits. For example, 97.0% received paid holidays, 95.6% were offered health insurance, and 93.3% were offered dependent health insurance. The turnover rate for this sector in third quarter 2007 was much lower than the statewide average (24.7% compared to 37.2%; Leonard, 2008a), and again in fourth quarter 2007 (22.9% compared to 34.8%; Leonard, 2008b).
Full-time employees in the financial activities sector were more likely to receive benefits than the statewide average. An estimated 92.8% of full-time employees received paid holidays, which was much higher than the average of 73.9%. A higher proportion also were offered health insurance (82.0%) and dependent health insurance (76.8%).
Professional & business services includes a broad group of different employers such as temporary help agencies, engineering firms, landscaping and snow removal companies, and law offices. Generally, employees in this sector were less likely to be offered benefits than the statewide average. This may reflect the fact that many firms in the sector were small. Approximately three-fifths of full-time employees (60.5%) in professional & business services were offered health insurance and 55.4% were offered dependent health insurance.
Educational & health services includes both public and private employers, such as school districts, hospitals, doctors’ offices, and colleges and universities. Some of these employers are very large, while others are quite small. Overall, employees in this sector were very likely to be offered benefits. For example, 90.3% of full-time employees were offered health insurance and 88.5% were offered dependent health insurance. More than 9 of 10 (91.8%) were offered a retirement plan. Even among part-time employees, 69.0% were offered a retirement plan, and 30.5% were offered health insurance.
Leisure & hospitality is a highly seasonal industry in Wyoming. In third and fourth quarter 2007, it had the highest turnover rate of all major industries (58.4% and 55.8%, respectively; Leonard, 2008a, 2008b). Not surprisingly, a much smaller proportion of its employees were offered benefits. Slightly more than one-quarter of full-time employees (26.4%) in this sector were offered a retirement plan, while only 35.7% were offered health insurance. The only benefit that more than half of full-time leisure & hospitality employees were offered was paid vacation (63.4%).
Other services includes such diverse employers as automotive repair services, hair salons, membership organizations, and commercial laundries. Full-time employees in this sector were slightly less likely than the statewide average to be offered various benefits. An estimated 74.9% of full-time employees in other services were offered health insurance, compared to the statewide average of 76.3%.
Full-time employees of state and local government were very likely to be offered benefits. Paid holidays were provided to 99.8% of full-time employees in this sector. Health insurance and dependent health insurance were offered to 87.3% and 86.1% of full-time employees, respectively.
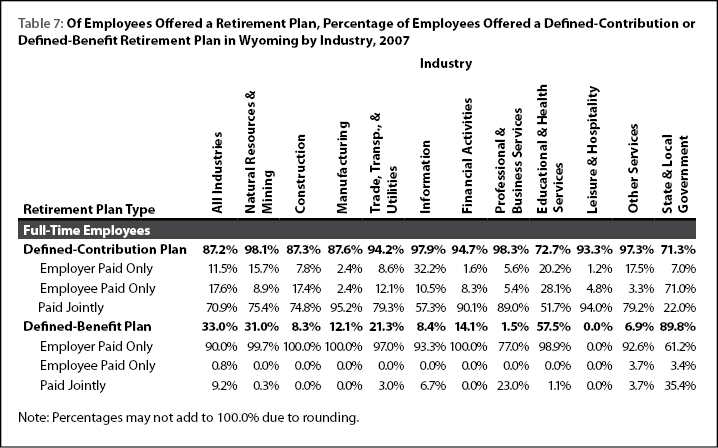
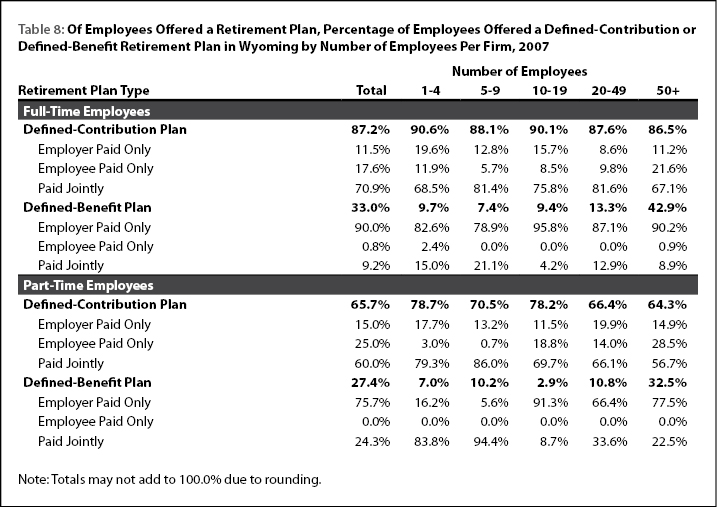
Table 7 provides detail on the type of retirement plan offered to employees. There are two basic types of retirement plans: defined contribution and defined benefit. In a defined-contribution plan, employers and/or employees make specific contributions (3% of wages each pay period, for example). Benefits are a function of contributions and the performance of various investment options. In many cases, defined-contribution plans are designed to be flexible (within certain limits, employees choose how much to contribute and how their contributions will be invested) and portable (separating employees can roll over their balances to an IRA or a new employer’s plan).
In contrast, defined-benefit plans provide benefits determined by a set formula, often based on years of service and highest salary. Some employers offer both a defined-benefit plan and a defined-contribution plan.
Of full-time employees offered a retirement plan, approximately one-third (33.0%) were offered a defined-benefit plan and almost 9 of 10 (87.2%) were offered a defined-contribution plan. These percentages varied greatly across industries. For example, in state and local government, 89.8% of full-time employees who were offered a retirement plan were offered a defined-benefit plan. Defined-benefit plans were also fairly common in education & health services (57.5%).
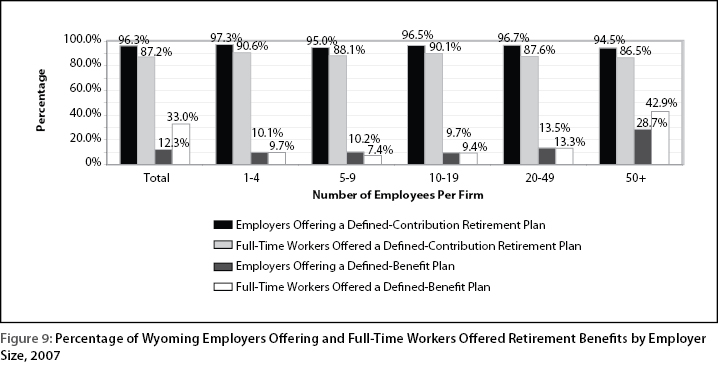
Defined-benefit retirement plans were more commonly offered to the employees of large firms than small firms (see Table 8). Among full-time employees of large firms who were offered access to a retirement plan, 42.9% were offered a defined-benefit plan. Figure 9 shows that across all size classes, more than 90% of employers who offered a retirement plan offered a defined-contribution plan.
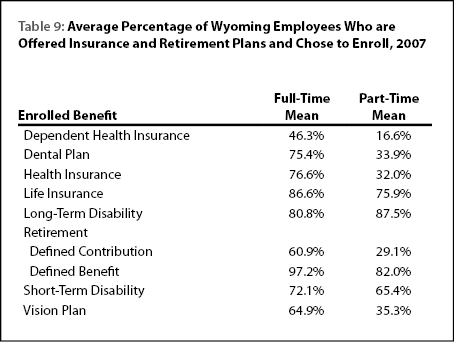
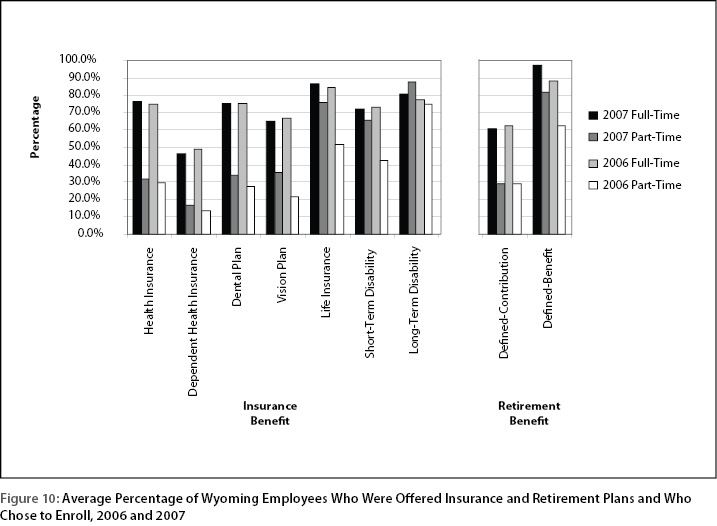
The average percentage of employees who were offered and chose to enroll in insurance and retirement plans is shown in Table 9. Slightly more than three-quarters (76.6%) of full-time employees who were eligible chose to enroll in health insurance, but a much smaller percentage (46.3%) enrolled their dependents. The highest enrollment rate for full-time workers was for defined-benefit retirement plans (97.2%). In many cases employees may be automatically enrolled in a defined-benefit plan. Figure 10 shows that enrollment rates for defined-benefit retirement plans increased for both full- and part-time workers from 2006 to 2007.
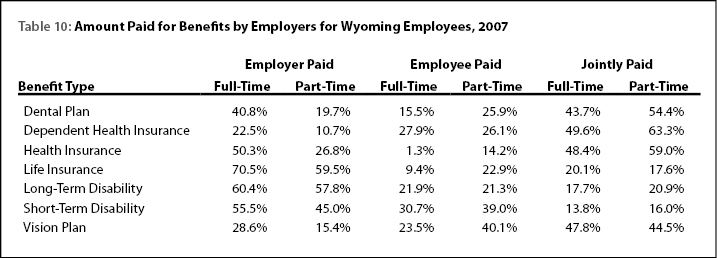
Part-time employees were most likely to enroll in long-term disability insurance (87.5%), a defined-benefit retirement plan (82.0%), and life insurance (75.9%). Table 10 addresses the important question of who pays for employer-provided health insurance. In 2007, the employer paid the full cost of health insurance for slightly more than half (50.3%) of full-time workers. For dependent health insurance, it was far more common for the premiums to be jointly paid (49.6%). An estimated 59.0% of part-time employees paid jointly for their health insurance. Life insurance, which may be relatively inexpensive compared to other benefits, was frequently fully paid by the employer for full-time (70.5%) and part-time (59.5%) workers.
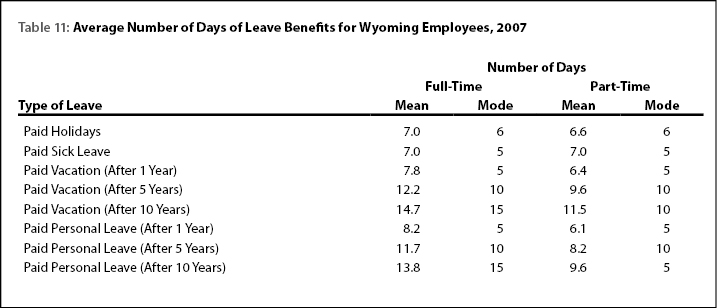
Full-time employees received an average of 7.0 days of paid holidays and part-time employees received 6.6 days (see Table 11). Part-time employees who qualified for sick leave received just as many days as their full-time counterparts (an average of 7.0 days). After 10 years the average employee was eligible for 14.7 days of paid vacation.