© Copyright 2006 by the Wyoming Department of Employment, Research & Planning

WYOMING LABOR FORCE TRENDS

Vol. 43 No. 8

Wyoming Normalized Unemployment Insurance Statistics: Initial Claims

by: Douglas W. Leonard, Senior Research Analyst

Only 992 initial claims were filed in June. This month's total is 16.1% lower than last month and 22.4% lower than June 2005.
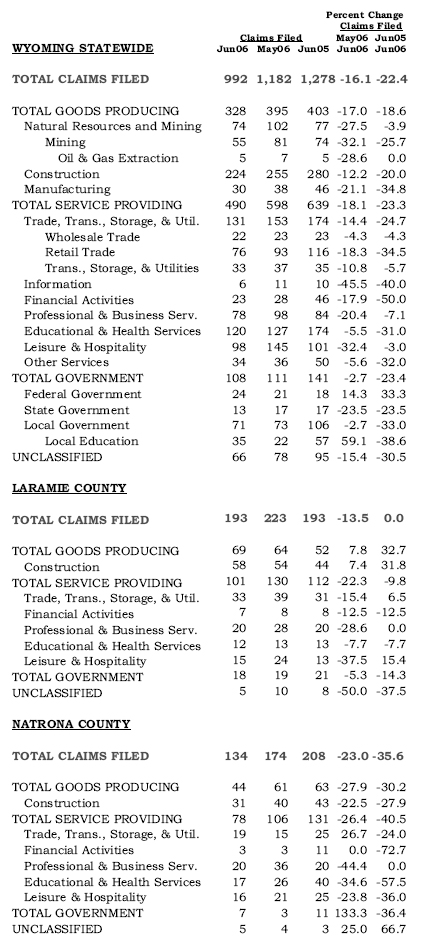
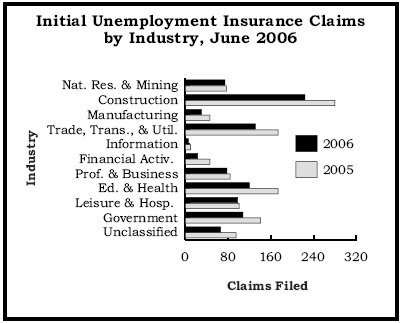
init (220K)
ic_industry (1174K)
ic_region (1194K)

Text Version


Percent Change Claims Filed Difference
Claims Filed Jun_06 Jun_06 Jun_06
Jun_06 May_06 Jun_05 May_06 Jun_05 Jun_05
Wyoming Statewide
Total Claims Filed     992  1,182  1,278 -16.1 -22.4 -286
Goods-Producing     328     395     403 -17.0 -18.6 -75
   Natural Resources and Mining (11,21)       74     102       77 -27.5 -3.9 -3
      Mining (21)       55       81       74 -32.1 -25.7 -19
         Oil & Gas Extraction (211)        5        7        5 -28.6 0.0 0
   Construction (23)     224     255     280 -12.2 -20.0 -56
   Manufacturing (31 - 33)       30       38       46 -21.1 -34.8 -16
Service-Providing     490     598     639 -18.1 -23.3 -149
   Trade, Transportation, and Utilities (22,42,44-45,48-49)     131     153     174 -14.4 -24.7 -43
      Wholesale Trade (42)       22       23       23 -4.3 -4.3 -1
      Retail Trade (44 - 45)       76       93     116 -18.3 -34.5 -40
      Transportation, Warehousing and Utilities (22,48 - 49)       33       37       35 -10.8 -5.7 -2
   Information (51)        6       11       10 -45.5 -40.0 -4
   Financial Activities (52, 53)       23       28       46 -17.9 -50.0 -23
   Professional and Business Services (54-56)       78       98       84 -20.4 -7.1 -6
   Educational and Health Services (61-62)     120     127     174 -5.5 -31.0 -54
   Leisure and Hospitality (71-72)       98     145     101 -32.4 -3.0 -3
   Other Services, except Public Admin. (81)       34       36       50 -5.6 -32.0 -16
Government     108     111     141 -2.7 -23.4 -33
   Federal Government       24       21       18 14.3 33.3 6
   State Government       13       17       17 -23.5 -23.5 -4
   Local Government       71       73     106 -2.7 -33.0 -35
      Local Education       35       22       57 59.1 -38.6 -22
Unclassified       66       78       95 -15.4 -30.5 -29
Laramie County
Total Claims Filed     193     223     193 -13.5 0.0 0
Goods-Producing       69       64       52 7.8 32.7 17
   Construction (23)       58       54       44 7.4 31.8 14
Service-Providing     101     130     112 -22.3 -9.8 -11
   Trade, Transportation, and Utilities (22,42,44-45,48-49)       33       39       31 -15.4 6.5 2
   Financial Activities (52, 53)        7        8        8 -12.5 -12.5 -1
   Professional and Business Services (54-56)       20       28       20 -28.6 0.0 0
   Educational and Health Services (61-62)       12       13       13 -7.7 -7.7 -1
   Leisure and Hospitality (71-72)       15       24       13 -37.5 15.4 2
Government       18       19       21 -5.3 -14.3 -3
Unclassified        5       10        8 -50.0 -37.5 -3
Natrona County
Total Claims Filed     134     174     208 -23.0 -35.6 -74
Goods-Producing       44       61       63 -27.9 -30.2 -19
   Construction (23)       31       40       43 -22.5 -27.9 -12
Service-Providing       78     106     131 -26.4 -40.5 -53
   Trade, Transportation, and Utilities (22,42,44-45,48-49)       19       15       25 26.7 -24.0 -6
   Financial Activities (52, 53)        3        3       11 0.0 -72.7 -8
   Professional and Business Services (54-56)       20       36       20 -44.4 0.0 0
   Educational and Health Services (61-62)       17       26       40 -34.6 -57.5 -23
   Leisure and Hospitality (71-72)       16       21       25 -23.8 -36.0 -9
Government        7        3       11 133.3 -36.4 -4
Unclassified        5        4        3 25.0 66.7 2


Initial Claims June 2006 June 2005
Natural Resources & Mining 74 77
Construction 224 280
Manufacturing 30 46
Trade, Transportation & Utilities 131 174
Information 6 10
Financial Activities 23 46
Professional & Business Svc. 78 84
Ed. & Health Svc. 120 174
Leisure & Hospitality 98 101
Government 108 141
Other 66 95


reg_count cmcy cmpy curr_yr prior_yr
YEAR 2006 2005 June 2006 June 2005
NORTHWEST June 2006 June 2005
Big Horn 175 237 June 2006 June 2005
Fremont 739 920 June 2006 June 2005
Hot Springs 52 100 June 2006 June 2005
Park 317 456 June 2006 June 2005
Washakie 150 203 June 2006 June 2005
NORTHEAST June 2006 June 2005
Campbell 277 488 June 2006 June 2005
Crook 56 77 June 2006 June 2005
Johnson 58 94 June 2006 June 2005
Sheridan 392 600 June 2006 June 2005
Weston 45 83 June 2006 June 2005
SOUTHWEST June 2006 June 2005
Lincoln 128 231 June 2006 June 2005
Sublette 40 65 June 2006 June 2005
Sweetwater 452 488 June 2006 June 2005
Teton 352 565 June 2006 June 2005
Uinta 201 382 June 2006 June 2005
SOUTHEAST June 2006 June 2005
Albany 389 408 June 2006 June 2005
Goshen 310 200 June 2006 June 2005
Laramie 1715 1559 June 2006 June 2005
Niobrara 23 23 June 2006 June 2005
Platte 149 148 June 2006 June 2005
CENTRAL June 2006 June 2005
Carbon 137 202 June 2006 June 2005
Converse 231 160 June 2006 June 2005
Natrona 1025 1306 June 2006 June 2005
OTHER June 2006 June 2005
Unknown (WY) 11 June 2006 June 2005
Out of State 917 1149 June 2006 June 2005