© Copyright 2006 by the Wyoming Department of Employment, Research & Planning
Vol. 43 No. 8

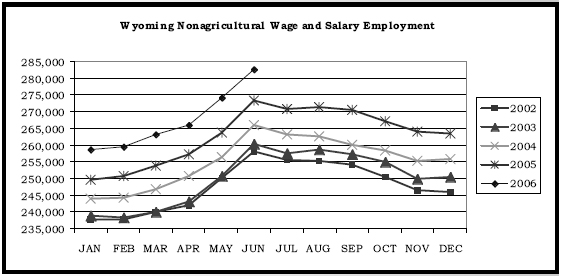
| JAN | FEB | MAR | APR | MAY | JUN | JUL | AUG | SEP | OCT | NOV | DEC | |
| 2002 | 237,900 | 237,700 | 240,200 | 242,200 | 250,200 | 258,200 | 255,700 | 255,400 | 254,200 | 250,500 | 246,500 | 246,100 |
| 2003 | 238,900 | 238,400 | 240,000 | 243,200 | 250,800 | 260,300 | 257,500 | 258,700 | 257,200 | 255,000 | 249,900 | 250,400 |
| 2004 | 243,900 | 244,300 | 246,900 | 250,800 | 256,400 | 266,000 | 263,200 | 262,800 | 260,100 | 258,400 | 255,400 | 256,000 |
| 2005 | 249,600 | 250,700 | 254,000 | 257,200 | 263,900 | 273,400 | 271,000 | 271,400 | 270,600 | 267,100 | 264,000 | 263,600 |
| 2006 | 258,700 | 259,700 | 263,300 | 266,200 | 274,200 | 282,600 |
Table of Contents | Labor Market Information |
Wyoming Job Network | Send Us Mail
Last modified on
by Phil Ellsworth.