Cashing Out? Labor Market Withdrawal by Wyoming Workers Age 45 and Older
Because of the aging baby-boomer cohort of the population, the number of working individuals age 45 and older in Wyoming increased between 2001 and 2006. During the same period, the rate at which those people exited the labor market grew more rapidly than could be explained by population aging. In light of the current strong economy and increasing wages, especially in certain industries, it may be expected that older residents would remain in the workforce rather than exit at an earlier age. The increased exit rate suggests either a change in the population itself or in the circumstances surrounding the population. After investigating effects of age, gender, divorce rates, migration, state of origin, industry, and wages, it was determined that none of the factors could be responsible for the increase in exits seen among the 45 and older population. However, a factor external to individual workers, the recent rapid increase in housing values, was found to be significantly related to the exit rate.
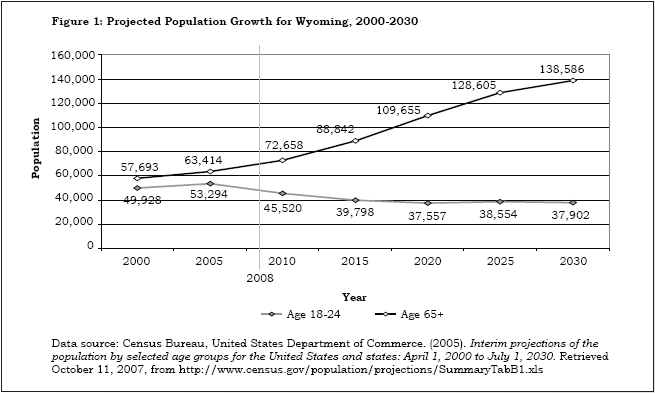
By most reported research, Wyoming is expected to be one of the oldest states in the country by the year 2020 (Batdorff, 2004; Wagner, 2004). This is largely an effect of the large numbers of baby boomers currently in the state (see Figure 1) but is also influenced by loss of younger residents (Jones, 2007), areas of the state becoming retirement destination counties (RUPRI, 2006), and the state’s mineral-based economy, which relies heavily on nonresident, impermanent labor. An older population has many implications, one of which is the state shouldering larger relative financial responsibility for Medicaid and other programs funded at the state and local level (Bean, Myers, Angel, & Galle, 1994). More workers drawing from programs that fund the elderly than workers paying into the programs may cause difficulties with solvency.
One of the major functions of Research & Planning (R&P) is the production of occupational projections. Overall projected employment is a function of growth and replacement need. In most states, the number of workers required to replace the retiring or exiting labor force is determined based on national rates of worker exit expressed as a constant/demographic segment. However, replacement need may be a variable subject to its own set of contingencies.
Job growth in the state has slowed recently but still remains strong (Bullard, 2008). The current economic expansion started in 1988 while the current “boom” started in 2005. Even though individual employers may have difficulty hiring employees, the economy as a whole is growing. Accordingly, the number of individual workers continues to rise (Jones, 2008). Maintaining an adequate workforce is likely to become more difficult over time, especially if competition from other states increases while the Wyoming market remains strong. Because of current expressed concern (Curran, 2007) and anticipated worker shortages, it is important to consider the role of retention strategies to reduce the outflow of workers from the state. Recruitment efforts may increase the number of workers who enter the state but do little to increase the overall number of workers in the state, as many of the new entrants leave within one quarter. Retaining the current labor supply appears to be an area worthy of further study.
It is well understood that Wyoming’s young residents exit the state in large numbers (Jones, 2008). However, little attention has been paid to the other end of the age continuum even though the numbers of older workers continue to rise. There has been discussion about a severe labor shortage as a function of impending retirement of the boom generation, but the discussions are based on the number of workers nearing traditional retirement age rather than specific data about retirement patterns of Wyoming workers (Research & Planning, 2006 and in press). At this point, it is unclear at what age most retirees exit the labor force. Given the size of the boom generation, we do know that the timing of withdrawal from the labor market, whether at age 56, 62, or 65, has serious implications for the supply of labor. Because of the current interest in, and obvious need for, succession planning, R&P decided to investigate workforce withdrawal patterns for workers age 45 and older. There is no other known research-based attempt to describe or explain the permanent withdrawal of workers from a state workforce using administrative records.
MethodologyUnemployment Insurance Wage Records for 2000 through 2007 were combined with the Wyoming Department of Transportation Driver’s License File in order to associate age and gender with earnings from wages. Only Wyoming residents (see Jones, 2004, for a discussion of residency) age 45 and older who worked in at least two consecutive years were included in the analysis. Exiters were defined as those who left employment in the state and did not return throughout the time series. Other theoretically relevant explanatory variables were developed for the analysis.
In order to minimize bias resulting from individuals exiting the workforce and then returning after an absence, the data were adjusted. Wage records for the years 1992 to 2006 were compiled in such a way that it was possible to determine when residents age 45 and older exited the market and whether they returned at any point thereafter. We then computed the average number of workers who returned to work after leaving the market for one to five years. The computation was done separately for men and for women as well as by age segment. The average number of workers who returned to work was then subtracted from the original number of exiters in each of the reference period years, 2002 through 2006, in order to control for market re-entry within five years. For example, in 2002 there were 1,446 women between the ages of 45 and 54 who left work and did not return by 2006. Using the adjustment factor, based on the previous patterns of market re-entry, we estimated that 3 women were likely to return to work in 2007. Obtaining the adjusted value meant subtracting 3 from 1,446 women to obtain 1,443.
The retirement age used in research is usually based on the social security eligibility ages of 62 or 65 (Uccello, 1998; U.S. GAO, 2001). However, we decided to investigate market withdrawal behavior for all Wyoming residents age 45 and older for the reasons discussed earlier. Doing so allowed the opportunity to look for patterns among individuals at the age when their children are most likely to leave the home. The tendency of the young to out-migrate may affect the migration discussions of parents. R&P research on the nursing occupation revealed that many nurses who came from another state and are presently working in Wyoming plan to leave as soon as their youngest child finishes school (Research & Planning, in press). If this finding applies more generally to other occupations and has predictive validity, the consequences would have far-reaching implications. For example, the projected elderly population would be significantly lower than currently expected if many of the aging baby boomers who previously moved to the state leave before they reach social security or retirement eligibility age.
To compute average wages we decided to eliminate the transition quarter of exiters (the last quarter before permanent exit). This was done because few people wait until the exact end of the quarter to terminate employment; therefore, the transition quarter wages are usually lower and not representative of the rate of compensation. Average earnings were computed using the last four quarters of wages prior to the exit quarter. For example, if an individual permanently left employment in the first quarter of 2006, his or her wages were averaged for the four quarters of 2005 even though he or she would appear as part of the 2006 exit cohort.
As in most R&P research, state of origin was determined based on the first three digits of the social security number (SSN). Numbers issued in Wyoming start with 520.
It is critical to note in this analysis that the most recent end point in the tabulation is 2006, the point in time when the first of the boom generation attained the age of 60. When administrative records become available for 2008, we will be able to study the interaction between those of the boom generation reaching the first of the traditional retirement ages (62) and the rate of exit from work in Wyoming.
Results and DiscussionGeneral Findings on Exit
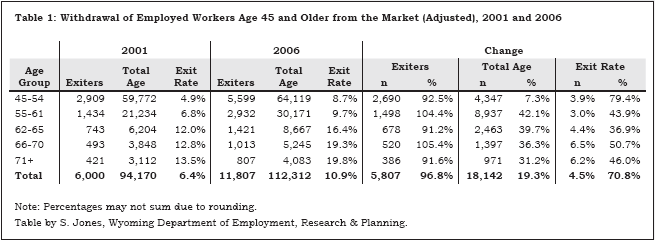
From 2001 to 2006, the number of working persons age 45 and older rose from 94,170 to 112,312 persons (19.3%; see Table 1) with the annual rate of change remaining fairly constant at 3%-4%.
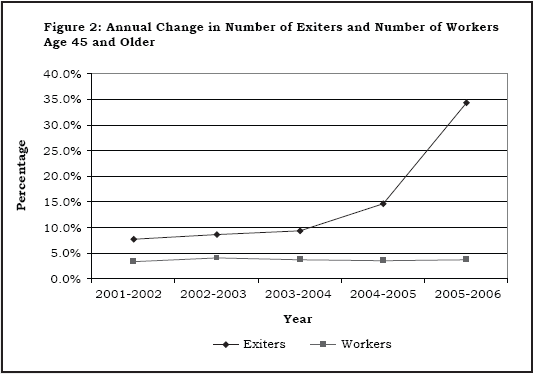
Unexpectedly, during the same period, the rate at which people 45 and older exited the labor market increased at an even greater rate. In 2001, 6.4% (6,000) of all workers 45 and older permanently exited the market. By 2006, the percentage rose to a 10.9% exit rate (11,807 exits). Furthermore, the change in the rate occurred abruptly in 2005 and 2006 (see Figure 2).
In light of the current strong economy and increasing wages, especially in certain industries, it may be expected that older residents would remain in the workforce, perhaps to enhance retirement earnings, rather than exit at an earlier age. As Figure 2 illustrates, prior to the recent economic expansion that began in 2005, the number of workers and the number of exiters age 45 and older increased at a fairly consistent rate. However, coinciding with the expansion, the annual change in the number of exiters increased rapidly from 10%-15% to almost 35% while the change in the number of workers remained constant. Because an expansion in the economy is typically associated with higher competition for labor, more job opportunities, and higher wages, a positive exit rate among established older residents seems counterintuitive. From the finding, one could reasonably discern that there was either a change in the characteristics of the population itself or in the circumstances surrounding the population. To determine which, we analyzed age, gender, divorce rates, mortality, migration, state of origin, industry of employment, wages, and housing sales.
Age
The first potential contributing factor to an increasing rate of exit among workers age 45 and older, at a time of economic expansion, was age. If the segment of older workers in 2006 was considerably older than the equivalent segment in 2000, we could easily explain why the exit rates increased. We decided to segment the age variable to best highlight exit and retirement behaviors.
In 2001, the exit rate among all workers age 45 and older was 6.4% (see Table 1). By 2006 the exit rate increased to 10.9%. The largest rise in exit rate occurred among those age 66-70, an increase of 6.5 percentage points (12.8% to 19.3%), and among those 71 and older, an increase of 6.2 percentage points (13.5% to 19.8%). The smallest change in exit rate was seen in the age group immediately preceding traditional retirement age (55-61) with an increase of 3.0 percentage points.
The largest change in the number of exiters occurred in the 45-54 age group, which almost doubled from 2,909 to 5,599 during the reference period. The 55-61 group followed closely with an increase of 1,498. Those in the oldest cohort (71+) showed the smallest change from 421 to 807 (386); however, the change was substantial.
Using percentage change as the measure (see Table 1), the youngest group exhibited the largest increase in exit rate with a 79.4% change. Those of traditional retirement age experienced the smallest percentage change with a 36.9% increase.
The 66-70 group reflected the largest percentage change in the number of exiters with an increase of 105.4%. The 55-61 segment closely followed with an increase of 104.4%. The smallest change was seen among those of traditional retirement age (91.2%).
By looking at exit patterns by age group, we found that the number of older workers exiting employment in Wyoming increased dramatically in all age groups, but most rapidly for those immediately surrounding traditional retirement age.
Essentially, the groups most at risk for exit from the market are those immediately prior to traditional retirement age. This is of potential concern because this group was expected to remain in the workforce for an additional 10-15 years. If the exit rates were highest for the oldest workers it would certainly affect the labor supply, but since an exodus of those 62 and older has been anticipated, it arguably would not be as serious a situation as an exodus of those younger than retirement age.
Gender Differences
The next logical factor examined was gender. If wages grew quickly enough to raise household income so that the average family would maintain their standard of living on one income, an increased number of secondary wage earners may have decided to exit the market.
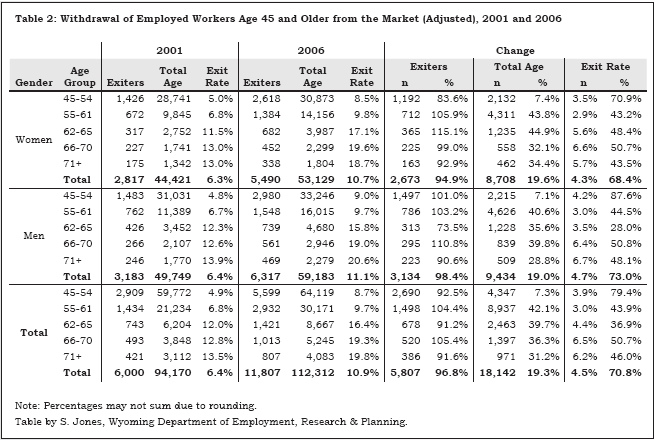
To investigate this potentiality, we looked at exit rates by gender as well as by age group. Table 2 demonstrates that among women, the largest change in exit rates was found among the age 66-70 group with an increase of 6.6 percentage points (13.0% to 19.6%). The 71 and older group followed closely with an increase of 5.7 percentage points (13.0% to 18.7%). The smallest change was seen in the 55-61 group, which experienced an increase of only 2.9 percentage points (6.8% to 9.8%).
The youngest group (45-54) showed the largest increase in the number of exiters, from 1,426 to 2,618 (an increase of 1,192). Those age 55-61 followed with an increase of 712 (672 to 1,384). The smallest change in number of exiters was found among the oldest workers, who increased from 175 to 338 (a change of 163).
As seen in Table 2, the youngest group of women also exhibited the largest percentage change in exit rate with an increase of 70.9%. The 66-70 group was a distant second with an increase of 50.7%. The smallest change of 43.2% was found among those age 55-61.
The 62-65 group showed the largest percentage change in the number of workforce exiters (115.1%). It was followed by the 55-61 group (105.9%). The smallest percentage change was among the youngest age group (45-54) but was still a rather substantial change (83.6%).
Because the number of younger workers changed very little (only 7.4%), the change in exit rate was a function of increased exits rather than a change in the number of workers. This is a significant finding because this younger group was not expected to leave the market for several more years. In the event of a sustained labor shortage, this group could potentially be “recruited” into working past retirement age. Leaving the workforce before retirement age certainly decreases that possibility.
Exit rates for men increased by 6.7 percentage points (13.9% to 20.6%) among the oldest age group (71+) and 6.4 percentage points (12.6% to 19.0%) among the second oldest age group (66-70) from 2001 to 2006 (see Table 2). The smallest change in exit rate was found in the 55-61 group with an increase from 6.7% to 9.7% (3.0 percentage points). The age 45-54 group demonstrated the highest increase in the number of male exiters (1,483 to 2,980) with the 55-61 group following (762 to 1,548). The smallest change of 223 (246 to 469) was found among the oldest group (71+).
The percentage change in exit rates for men increased impressively by 87.6% for the youngest group (45-54). All the other groups clustered closely together between 40% and 50% with the exception of the 62-65 group, which fell at 28.0%.
Unlike women, men age 66-70 and 55-61 showed the largest percentage increases in the number of exiters (110.8% and 103.2%, respectively).
Like women, the younger group of male workers had minimal change (7.1%), meaning that a significant portion of those approaching retirement are withdrawing from the workforce. However, pattern changes among men of traditional retirement age are occurring at a slower rate than among other age groups.
For the most part, men and women had similar exit pattern behavior, effectively refuting the idea that women are leaving the workforce in response to increased wages for men.
Divorce Rates
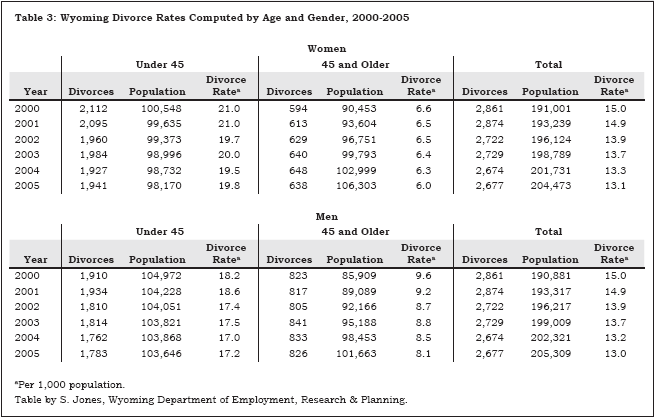
To investigate the possibility that an increased proportion of divorces among Wyoming residents age 45 and older during the reference period was related to the increased exit rate from the workforce, we utilized the Wyoming Health Department Divorce File (2007). If the divorce rate increased, it could potentially explain the increase in exits from the Wyoming workforce because families (or part of the family) may choose to leave the state after dissolution of a marriage. After separating the divorces by age into two segments (under 45 and 45 and older), divorce rates decreased between 2000 and 2005 (see Table 3). Consequently, divorce does not appear to be a factor in the increased exit rate from the Wyoming workforce.
Migration
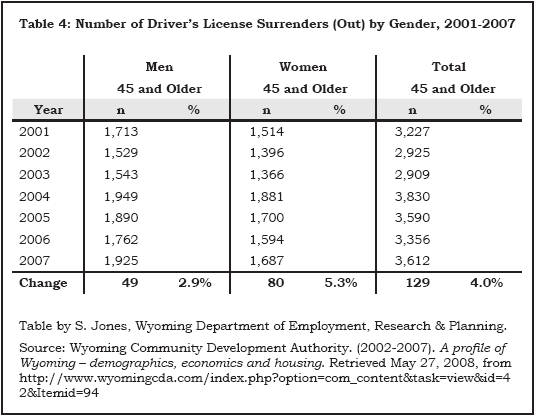
Migration is another possible contributor. Just as migration into the state could be a factor in the increase in older workers, migration out of the state could be a factor in the increase in workforce exits. Using the Driver’s License Surrender data (Wyoming Community Development Authority, 2002-2007), we were able to estimate an increase of 4.0% in the number of individuals over the age of 45 who surrendered a Wyoming license to another state between 2001 and 2007 (see Table 4). The data are limited because not everyone who moves decides to immediately obtain a new license in the destination state. While an obvious contributor to the number of exits, out-migration does not appear to be the final answer.
State of Origin
Because there are currently more workers who came from out of state than in-state (Jones, 2006) and because of nurses’ comments about wanting to relocate out of state when children complete school (Research & Planning, in press), we decided to find out if state of origin was a contributing factor. Higher exit rates among those who originated from a different state may validate anecdotal evidence.
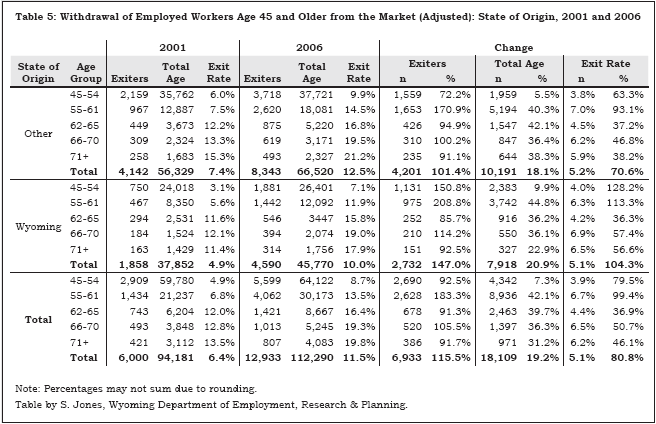
During the reference period, there were more workers age 45 and older as well as more exits among those from another state (see Table 5). In 2001, workers in Wyoming who received their social security number in a different state were much more likely to withdraw from the workforce at an earlier age (45-54) than those with an SSN that originated in Wyoming. However, between 2001 and 2006 the proportion of exiters age 45-54 from out of state decreased from 52.1% (2,159) to 44.6% (3,718) while the percentage of exiters age 45-54 from in-state increased slightly from 40.4% (750) to 41.0% (1,881). This change served to bring the distributions for the two groups much closer together so that by 2006 there was little difference between the age distributions of in-state and out-of-state exiters.
Table 5 shows that the percentage change in the number of workers age 45 and older for those who originated in Wyoming was slightly larger than for those who originated out of state (20.9% and 18.1%, respectively). In contrast, the percentage change in the number of withdrawals was substantially higher for those from in-state (147.0% compared to 101.4%). Essentially, both groups increased the number of workers at an equivalent rate. However, workers who originated in the state withdrew from the market at a faster pace than those who originated elsewhere. The same pattern was seen in the exit rates.
The change among exiters was higher for the in-state than the out-of-state group in every age group except traditional retirement age (62-65).
The largest differences in age between the in-state and out-of-state groups were in the youngest groupings. The change in exit rate for those 45-54 was 63.3% among those without an SSN issued in Wyoming. For those from Wyoming the change was a difference of 64.9 percentage points. The exit rate of the pre-retirement group (55-61) changed by 93.1% for out-of-state originators and 113.3% for in-state originators, a difference of 20.2 percentage points.
With the approach of retirement age, residents who originated outside of Wyoming were expected to leave the state at a higher rate than those who originated in the state. Experience suggests that individuals seek out family in their later years, making it seem reasonable to propose for analysis that those with an out-of-state SSN were more likely to have family out of state, and therefore were more likely to leave the state at retirement in order to be closer to that family. An analysis of exit data suggests otherwise. While those from other states were more likely to leave the state after the age of 44, those from in-state appear to be accelerating their rate of exit. Perhaps instead of non-Wyoming originators going “home” after withdrawal from the market, Wyoming originators are leaving the state to follow their children, who leave the state in large numbers for other reasons.
Industry Differences
Another potential contributing factor is industry of employment. If the increase in exits was confined to either a single industry or a set of industries rather than universally spread across all industries, it might be possible to develop and test the idea that something inherent to those sectors (such as wage level, skills transferability, prevalence in the state, etc.) was responsible for the exit behavior observed. We know that some sectors are more at risk for worker shortages than others because of an aging workforce. Increased exits in those industries would not be surprising as increased retirements have been predicted and expected.
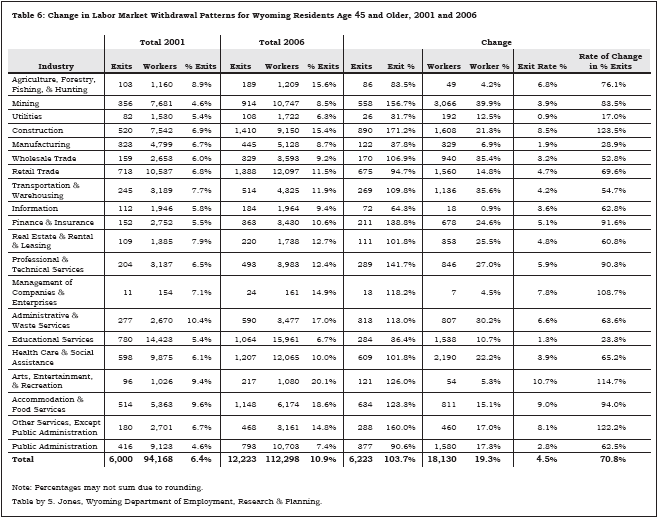
Table 6 shows total exits in 2001 and 2006 by industry of primary employment. The first major finding is that there is little variance between industries in the number of workers age 45 and older. All sectors increased in the number of workers and, with few exceptions, the increase was proportionally similar.
The change in the number of exits by Wyoming workers age 45 and older was much more dramatic than the change in the number of workers age 45 and older. The mean change in the number of exits was 103.7%, but the observations were variable, ranging from a 31.7% increase in exits to a 171.2% increase. Of the 20 industries, 13 more than doubled the number of exits of workers age 45 and older during the reference period.
The change in exit rate was also fairly variable. The average change was 70.8% but the values ranged between a low in utilities (17.0%) and a high in construction (123.5%).
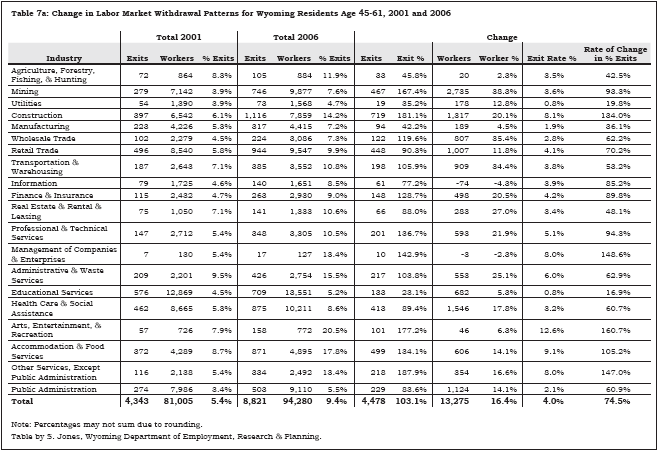
Because the observed differences in industry exits could be driven by age, we decided to break out the findings into two groups: pre-retirement (45-61) and retirement (62 and older). As shown in Table 7a, the pre-retirement group was substantially larger than the retirement group and, as such, was very similar in pattern to the overall group.
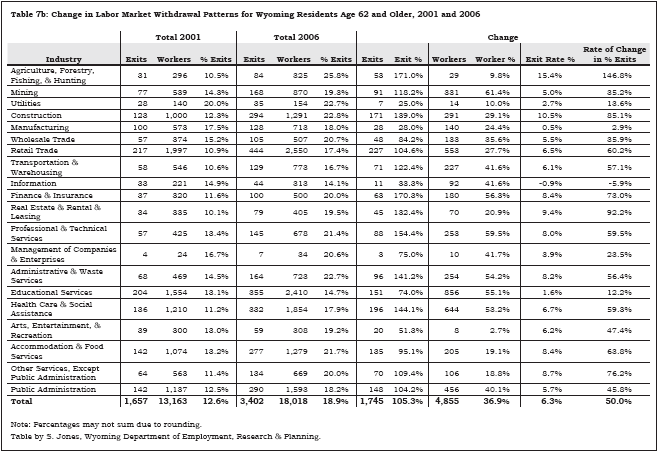
The retirement group, alternatively, did vary somewhat from the overall observations (see Table 7b). One of the most interesting findings was that the largest changes in the number of workers age 62 and older occurred in mining (61.4%), professional & technical services (59.5%), and finance & insurance (56.3%). This is an indication of which sectors are aging most quickly. However, the change in the number of exits was largest in agriculture, forestry, fishing, & hunting (171.0%) and finance & insurance (170.3%). Industries expecting a large exodus of retiring workers, such as educational services and health care & social assistance, appeared to be shielded, at least during the reference period. They both experienced a fairly large increase in the number of older workers but a fairly small increase in the number of exits. Essentially, between 2001 and 2006, the number of workers staying past retirement age increased. Perhaps intervention strategies such as flexible work schedules are being used to retain employees.
Again, the industry detail was interesting and highlighted some differences between the sectors; however, the distribution of exits among the industries did not change enough between 2001 and 2006 to explain the increased exit rates. This indicates that whatever is “causing” the change in exit behavior is related to the market as a whole or the individuals involved, not to the industries that employed them before exit.
Wages
While unlikely considering the current perceived worker shortage in the state, it may be that employers are offering early retirement incentives to their higher paid workers in an effort to cut costs. If true, wages would be associated with increased exit rates among workers 45 and older. Also, wage increases among exiters could support the proposition that worker retirement becomes viable because a recent history of strong wages has increased retirement benefits. Alternatively, low wages could be reason to search elsewhere for work. The need to save for retirement is of significant interest among those approaching traditional retirement age.
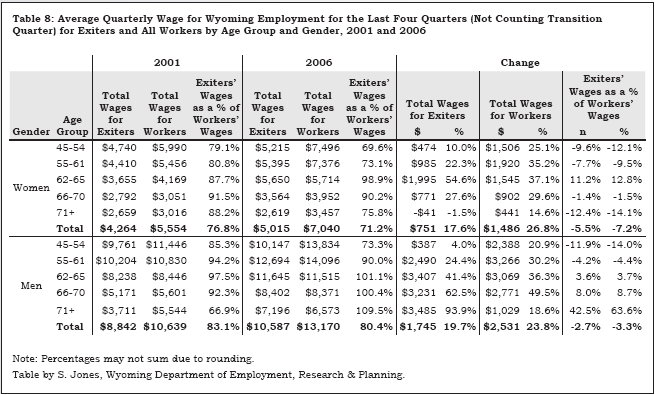
Analysis of the data provided findings inconsistent with a wage explanation for the change in the rate of exit between 2001 and 2006. Throughout the reference period, wages for exiters were consistently lower than average wages for workers in general (see Table 8). This was true for men and women and in most age groups. For women, wages for all workers (including the subset of exiters) increased by 26.8% while wages for exiters alone increased by 17.6%. For men, the wages for all workers increased by 23.8% while wages for exiters increased by 19.7% between 2001 and 2006. The percentage of worker wages earned by exiters decreased over time for both genders and most age groups. For women, the percentage of wages earned by exiters decreased in all age segments with the exception of those in traditional retirement age (62-65). For men, the percentage of wages earned by exiters decreased in only the youngest two groups and actually increased substantially (63.6%) in the oldest group (71+).
It is apparent that workers were generally not leaving because they were highly paid. Workers age 45 and older, as a whole, were paid more and were increasing their wages at a more rapid pace than those who exited. We cannot rule out that exiters may have been employed in lower-paying occupations or may have worked fewer hours than the average worker. However, the possibility does exist that exiters left because of their lower wages. The reason for the lower wages is unknown.
After examining several factors in an attempt to identify a difference in the characteristics between the 2001 and 2006 cohorts of Wyoming workers age 45 and older, we cannot determine that the segments are distinct in any meaningful way. Therefore, we can only postulate that external factors explain the differences.
Sale of Housing
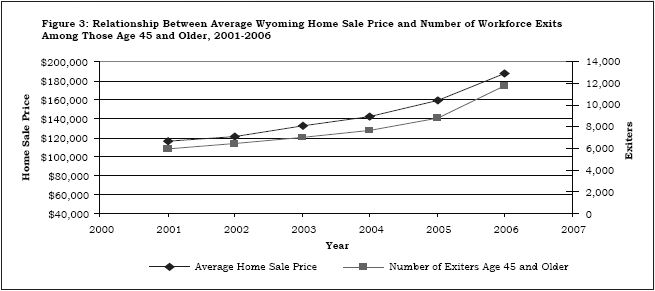
A factor external to individual workers, the recent rapid increase in housing values, could be related to the exit rates of older workers. Workers approaching retirement age may be opting to cash out their home equity while prices are high rather than waiting to see the long-term market results. Assets obtained from home sales may be enough to boost retirement funds and make retirement a more viable option. Additionally, less expensive housing in other areas of the country related to the housing market collapse may be a significant pull for Wyoming workers.
To see if home sales were related to exit rates, we used home sale data from the Wyoming Community Development Authority (2002-2007) compared to the change in exit rates from 2001 to 2006. We found a .99 correlation between the average home sale price and the number of exits when using all county information and a .96 correlation when data for Teton County were excluded (see Figure 3). Home sales are likely not the whole answer and we cannot imply causation, meaning we cannot say that the increase in home sale prices caused more older workers to exit the market. However, we can say with a high degree of certainty that they are strongly related.
ConclusionWorkers at the leading edge of the baby boom generation were age 60 in 2006, the end point for the analyses contained in this article. If they were long-term residents of the state, they would have been age 38 during the last “bust” cycle. The group potentially experienced the decrease in job availability and the decline in real estate prices associated with the economic slowdown. Therefore, there is the possibility that the effects of the last boom are still being felt in the state today in the form of workers age 45 and older “cashing out” of the Wyoming market while the state is still in the boom segment of the cycle. Combined with less expensive real estate prices in other areas of the country and the continued out-migration of younger residents, it seems possible that workers at or near retirement age would sell their property and relocate to areas closer to where their children move. This behavior is unlikely to curtail as long as housing prices are high and could be more prevalent among those who originated from in-state because of more equity due to longer home ownership.
ReferencesBatdorff, A. (2004, May 17). The best last place: Wyoming wants to capitalize on baby boomer potential. Billings Gazette. Retrieved May 27, 2008, from http://www.billingsgazette.com/newdex.php?display=rednews/2004/05/17/build/wyoming/30-baby-boomer.inc
Bean, F.D., Myers, G.C., Angel, J.L., & Galle, O.R. (1994). Geographic concentration, migration, and population redistribution among the elderly. Demography of aging (pp. 319-351). Retrieved May 20, 2008, from http://books.nap.edu/openbook.php?record_id=4553&page=319
Bullard, D. (2008, January). Covered employment and wages for second quarter 2007: Payroll growth moderates. Wyoming Labor Force Trends, 45(1). Retrieved May 20, 2008, from http://doe.state.wy.us/LMI/0108/a1.htm
Curran, D.E. (2007, July 1). Statewide effort eyes worker shortage. Wyoming Business Report. Retrieved April 29, 2008, from http://www.wyomingbusinessreport.com/article.asp?id=87179
Gendell, M. (2001, October). Retirement age declines again in 1990s. Monthly Labor Review, pp. 12-21. Retrieved May 20, 2008, from http://www.bls.gov/opub/mlr/2001/10/art2full.pdf
Hauf, D., Knapp, L., & Leonard, D. (2008, March). Wages & benefits in Wyoming – 2008. Retrieved May 20, 2008, from http://doe.state.wy.us/LMI/OES_2008.pdf
Jones, S.D. (2004, August). Worker residency determination – Wyoming stepwise procedure. Wyoming Labor Force Trends, 41(8). Retrieved May 7, 2008, from http://doe.state.wy.us/LMI/0804/a1supp.htm
Jones, S.D. (2006, April). States of origin for Wyoming workers. Wyoming Labor Force Trends, 43(4). Retrieved May 20, 2008, from http://doe.state.wy.us/LMI/0406/a1.htm
Jones, S.D. (2007, April). Demographic effects of Wyoming’s energy-related expansion. Wyoming Labor Force Trends, 44(4). Retrieved May 20, 2008, from http://doe.state.wy.us/LMI/0407/a1.htm
Jones, S.D. (2008, January). Persons working in jobs covered by Wyoming state Unemployment Insurance, third quarter 2007. Wyoming Labor Force Trends, 45(1). Retrieved May 20, 2008, from http://doe.state.wy.us/LMI/0108/a4.htm
Research & Planning. (2006). Worker retention and factors associated with retirement. Retrieved May 27, 2008, from http://doe.state.wy.us/LMI/SP_report.pdf
Research & Planning. (in press). Nursing retention study. Forthcoming report will be available at http://doe.state.wy.us/LMI/nursing.htm
Rural Policy Research Institute (RUPRI). (2006, October). Demographic and economic profile: Wyoming. Retrieved December 12, 2007 from http://www.rupri.org/Forms/Wyoming.pdf
Saulcy, S. (2007, September). Dying on the job: Wyoming occupational fatalities, 2003-2005. Wyoming Labor Force Trends, 44(9). Retrieved May 20, 2008, from http://doe.state.wy.us/LMI/0907/a1.htm
Uccello, C.E. (1998, October). Factors influencing retirement: Their implications for raising retirement age. Retrieved May 20, 2008, from http://assets.aarp.org/rgcenter/econ/9810_retire.pdf
United States General Accounting Office (U.S. GAO). (2001, November). Older workers: Demographic trends pose challenges for employers and workers. GAO-02-85. Report to the Ranking Minority Member, Subcommittee on Employer-Employee Relations, Committee on Education and the Workforce, House of Representatives. Retrieved May 20, 2008, from http://www.gao.gov/new.items/d0285.pdf
Wagner, A. (2004). With booming elderly population, west braces for more. Retrieved May 27, 2008, from http://www.signonsandiego.com/news/nation/20041124-1249-thegrayingwest.html
Wyoming Community Development Authority. (2002-2007). A profile of Wyoming – demographics, economics and housing. Retrieved May 27, 2008, from http://www.wyomingcda.com/index.php?option=com_content&task=view&id=42&Itemid=94
Wyoming Health Department Vital Statistics data. (2007). Divorce File. Unpublished microdata.
Return to text
Return to text
Return to text
Return to text
Return to text
Return to text
Return to text
Return to text
Return to text
Return to text
Return to text
Return to text
Last modified on
by April Szuch.