Covered Employment and Wages for Second Quarter 2007: Payroll Growth Moderates
In second quarter 2007, jobs and payroll in Wyoming continued to grow faster than their five-year averages, but moderated from the rapid growth seen during 2006. Employment rose in almost every county in the second quarter and payroll growth also was widespread. These economic changes help us gauge the strength of Wyoming's economy and identify the fastest and slowest growing industries and geographic areas.
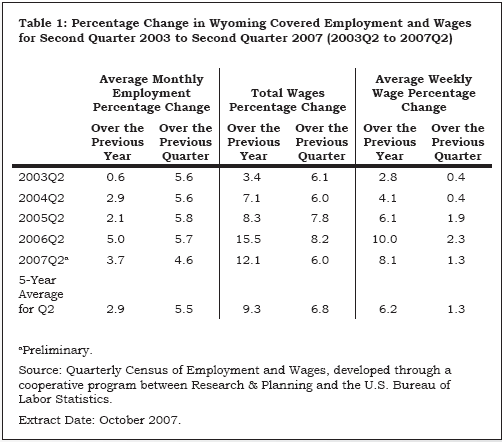
Jobs and payroll in Wyoming continued to grow faster than their five-year averages, but moderated from the rapid growth seen during 2006. From second quarter 2006 to second quarter 2007, total Unemployment Insurance (UI) covered payroll grew by $290.2 million (12.1%), somewhat faster than its five-year average (9.3%; see Table 1). UI covered payroll represents approximately 92% of all wage and salary disbursements and 45% of personal income in the state (U.S. Bureau of Economic Analysis, 2007). Average weekly wage rose by $55 (8.1%), also faster than its five-year average (6.2%). Employment increased by 10,049 jobs (3.7%).
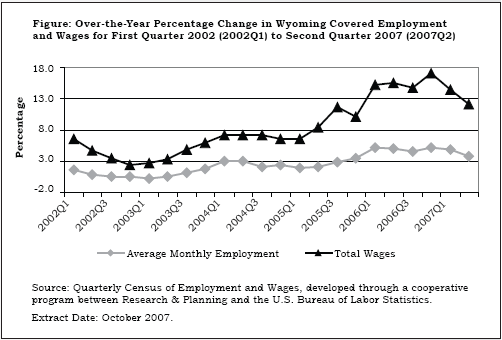
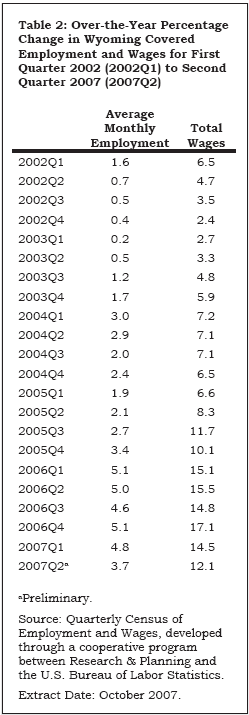
The covered payroll and employment data in this article are measured by place of work, unlike the labor force estimates (see page 21), which are a measure of employed and unemployed persons by place of residence. The Figure shows that job growth accelerated from 0.2% in first quarter 2003 to 5.0% in first quarter 2006, but slowed to 3.7% in second quarter 2007. Total payroll growth rose from 2.4% in fourth quarter 2002 to 17.1% in fourth quarter 2006, then decreased to 12.1% in second quarter 2007 (see Table 2). The recent moderation in payroll and employment growth may be related to decreases in the Baker Hughes North American Rotary Rig Count (2007), which fell from 102 in June 2006 to 77 in June 2007.
Statewide Employment and Wages by IndustryThe purpose of this article is to show employment and payroll changes between second quarter 2006 and second quarter 2007. These economic changes help us gauge the strength of Wyoming's economy and identify the fastest and slowest growing industries and geographic areas.
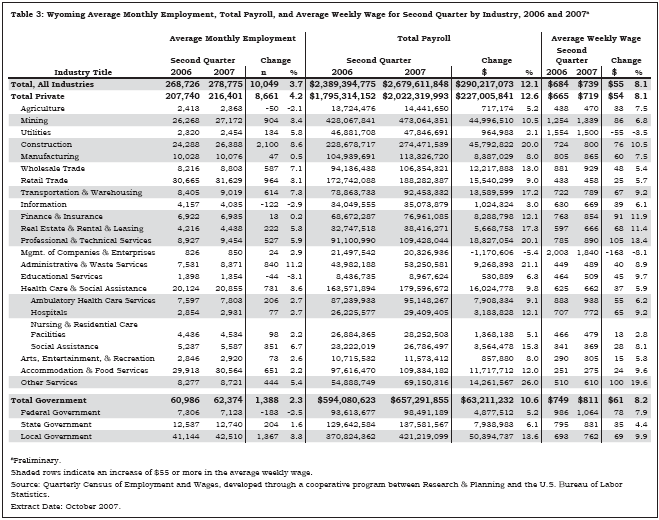
Table 3 shows the largest job gains were found in construction, local government, retail trade, and mining. Job losses occurred in federal government, information, agriculture, and private educational services. Some of these job losses may be a function of workers with transferable skills moving to higher wage growth industries.
Construction added 2,100 jobs (8.6%) and total payroll grew by $45.8 million (20.0%). Employment fell slightly in construction of buildings, but grew rapidly in heavy & civil engineering construction. Within heavy & civil engineering construction, the strongest growth was in oil & gas pipeline & related structures construction (approximately 1,400 jobs).
Local government (including public schools, colleges, and hospitals) added 1,367 jobs (3.3%) in second quarter. Total payroll increased by $50.4 million (13.6%). Within local government, educational services gained more than 600 jobs, hospitals gained more than 200 jobs, and public administration (including cities, towns, and counties) added approximately 400 jobs.
Employment in retail trade increased by 964 jobs (3.1%) and its total payroll grew by $15.5 million (9.0%). Strong job growth was seen in motor vehicle & parts dealers, building material & garden supply stores, and general merchandise stores (including warehouse clubs & supercenters). Modest job losses appeared in food & beverage stores; sporting goods, hobby, book, & music stores; and nonstore retailers.
Total payroll in mining increased by $45 million (10.5%) and employment increased by 904 jobs (3.4%). Oil & gas extraction added approximately 100 jobs, mining (except oil & gas) added more than 400 jobs, and support activities for mining added approximately 350 jobs. Within support activities for mining, employment fell by almost 700 jobs in drilling oil & gas wells, but this was more than offset by gains in support activities for oil & gas operations.
Federal government employment fell by 183 jobs (-2.5%), but total payroll increased by $4.9 million (5.2%). It appears that employment fell slightly at a number of federal agencies.
Employment fell by 122 jobs (-2.9%) in the information sector. This employment decrease was partially related to noneconomic code changes, including the introduction of the North American Industry Classification System 2007 (see article, page 12). Some firms previously classified in this sector were moved to administrative & waste services.
Even though its total payroll increased by $717,174 (5.2%), employment in agriculture fell by 50 jobs (-2.1%). The largest job losses occurred in crop production. Job losses in agriculture may be related to drought.
Private educational services employment decreased by 44 jobs (-3.1%). Its total payroll increased by $530,889 (6.3%) and average weekly wage rose by $45 (9.7%).
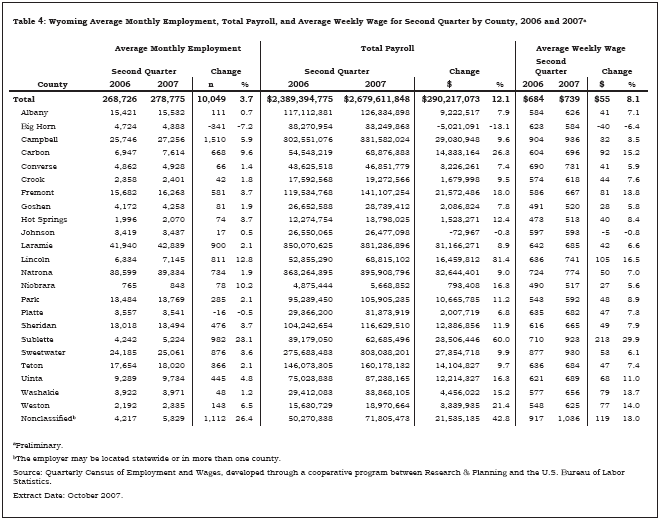
Employment and Wages by CountyEmployment rose in almost every county in the second quarter (see Table 4) and payroll growth also was widespread.
Total payroll increased by $29.0 million (9.6%) and employment increased by 1,510 jobs (5.9%) in Campbell County. The largest job gains occurred in construction (more than 600 jobs) and retail trade (approximately 250 jobs). Strong growth also was seen in local government (including public schools and hospitals), wholesale trade, and other services.
Sublette County's total payroll rose by $23.5 million (60.0%) and employment grew by 982 jobs (23.1%). By far the largest job gains were in mining (including oil & gas), approximately 700 jobs. Notable job gains were also seen in retail trade, transportation & warehousing, and administrative & waste services.
Sweetwater County's total payroll increased by $27.4 million (9.9%) and employment grew by 876 jobs (3.6%). Large job gains were seen in transportation & warehousing, mining, administrative & waste services, accommodation & food services, and local government. Employment fell in construction.
Employment increased by 811 jobs (12.8%) in Lincoln County and total payroll increased by $16.5 million (31.4%). The construction sector added more than 600 jobs and approximately $12 million in payroll. Other job gains occurred in local government (including public schools and hospitals), retail trade, transportation & warehousing, and health care & social assistance.
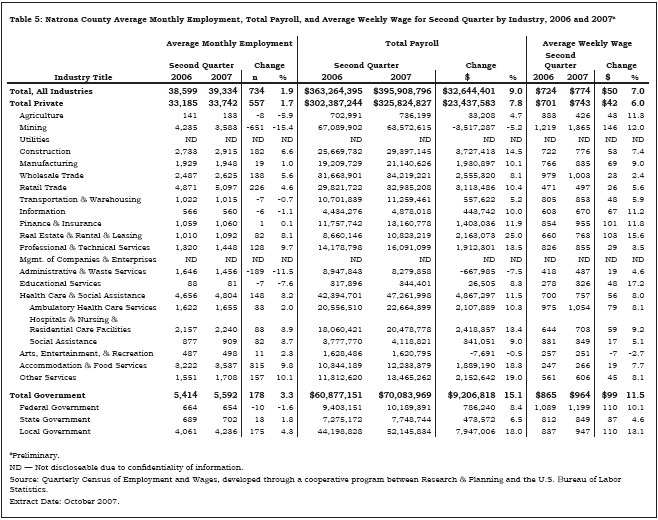
Table 5 shows that employment rose by 734 jobs (1.9%) in Natrona County. Accommodation & food services added 315 jobs (9.8%) and retail trade added 226 jobs (4.6%). Local government (including public schools and colleges) posted the largest growth in total payroll ($7.9 million, or 18.0%) and added 175 jobs (4.3%). Health care & social assistance had the second largest increase in total payroll ($4.9 million, or 11.5%). Notable job losses were seen in mining (-651 jobs, or -15.4%) and administrative & waste services (-189 jobs, or -11.5%). The apparent job losses in mining are the result of the reclassification of a large firm out of Natrona County into the nonclassified region.
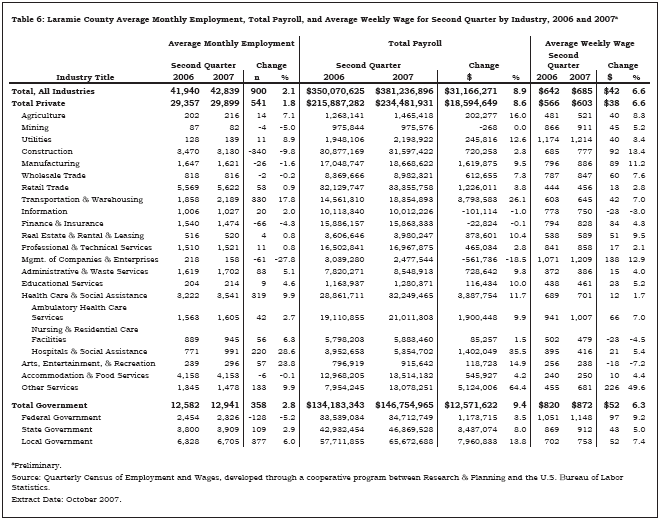
Laramie County's total payroll increased by $31.2 million (8.9%) and employment rose by 900 jobs (2.1%; see Table 6). Local government (including public schools, colleges, and hospitals) added 377 jobs (6.0%) and increased its total payroll by $8.0 million (13.8%). Other large job gains occurred in transportation & warehousing (330 jobs, or 17.8%) and health care & social assistance (319 jobs, or 9.9%). Job losses were noted in construction (-340 jobs, or -9.8%), federal government (-128 jobs, or -5.2%), finance & insurance (-66 jobs, or -4.3%), and management of companies & enterprises (-61 jobs, or -27.8%). Some workers in these jobs may have relocated, or begun commuting, to other counties. Job losses in construction may be related to conditions in the housing market.
Big Horn County's employment fell by 341 jobs (-7.2%) and payroll fell by $5.0 million (-13.1%), but this was mostly related to a noneconomic code change. A large firm was reclassified to Sublette County, where a majority of its employees work.
In Platte County, total payroll increased by $2.0 million (6.8%), but employment fell slightly (-16 jobs, or -0.5%). Modest job losses were seen in a number of sectors, including construction, transportation & warehousing, information, professional & technical services, and health care & social assistance. Employment increased in retail trade and accommodation & food services.
In summary, employment and payroll growth moderated in second quarter 2007. Wyoming's construction sector continued to post large job gains, but growth in mining (including oil & gas) slowed from earlier quarters. Employment increased in almost all counties, with the strongest growth reported in areas affected by oil & gas activity.
ReferencesBaker Hughes North American Rotary Rig Counts (2007, December 7). Retrieved December 13, 2007, from http://www.bakerhughes.com/investor/rig/rig_na.htm
U.S. Bureau of Economic Analysis. (2007, May 15). SA04 State income and employment summary - Wyoming. Retrieved May 15, 2007, from http://www.bea.gov/regional/spi/action.cfm
Return to text
Return to text
Return to text
Return to text
Return to text
Return to text
Return to text
Last modified on
by April Szuch.