© Copyright 2006 by the Wyoming Department of Employment, Research & Planning
Vol. 43 No. 6
The forecasted increases in heating costs for this winter will cause consumers to spend less in other areas and more for heating their homes. Because 2001 also had large increases for utilities, consumer expenditures and employment were studied to predict what may happen in 2006. Wyoming seems to have a positive result with employment in oil & gas extraction and support activities increasing.
The Consumer Price Index for All Urban Consumers (CPI-U) is a monthly national data series that measures changes in prices paid by urban consumers for a representative basket of goods and services. This important survey is used not only as an economic indicator, but also to pinpoint areas of change that could affect other statistics such as employment. The CPI-U is most widely used as a measure of inflation and as a deflator of other economic series.
In the Table, the CPI-U for May 2006 (Bureau of Labor Statistics [BLS], 2006) was 201.9, a slight increase from April (201.0). Looking back at the seasonally adjusted annual rate percent change for the 3 months ending in November 2005, there was an increase of 3.3%. However, there were some large increases, especially in the category of fuels & utilities (48.7%). Under fuels & utilities, fuel oil & other fuels increased by 34.2% and gas (piped) & electricity rose 62.7%. Fortunately for consumers, these increases were partially offset by a drop of 20.5% for gasoline. This was just a temporary reprieve as gasoline increased 95.5% for the 3 months ending in May 2006. Gasoline prices hit a high in September 2005 (CPI-U of 245.3) and then declined through December hitting a low of 193.0. In May 2006, CPI-U for gasoline was at 240.4 compared to 245.3 in September 2005 (BLS, 2005).
In the past, prices for natural gas have been very volatile. The CPI for utility gas peaked in January 2001 with annual increases in excess of 50.0%, but then declined until it hit a low in March 2002. It has been rising steadily since then. According to the Energy Information Administration (EIA, 2005), in December 2005 nearly 36.0% of normal daily Federal Gulf of Mexico oil production and approximately 29.0% of natural gas production remained shut-in due to hurricanes Rita and Katrina. Even in May 2006, some of the refineries in the Gulf area were not back to full production (EIA, 2006).
During 2001, natural gas prices hit a high that was not reached again until late 2004. To compare the effect of price increases on consumer spending, the average annual Consumer Expenditure Survey (BLS, 2003) can be used to determine how much consumers spend in different item categories (e.g., housing, food, healthcare). Unfortunately, there is a two-year lag so it will be 2007 before we have 2005 expenditures. Since the price increase of natural gas in 2001 is similar to what is happening currently, 2001 expenditures were studied to predict what will happen in 2006. Income spent on home utilities increased 11.2% in 2001 as compared to 2000, but even with this increase consumers spent only 7.0% of their total expenditures on utilities. Nationally, the winter of 2001 was colder than the winter of 2000 (National Oceanic and Atmospheric Administration, 2004) which may explain why expenditures for utilities increased more than the CPI-U (8.9%). The only other significant increases for 2001 on the Consumer Expenditure Survey were housing costs and pensions, which may signify that consumers were thinking about investments for the future during the economic downturn. Some expenditure areas that decreased for 2001 on the Consumer Expenditure Survey were alcoholic beverages, household furnishings & equipment, apparel & related services, public transportation, and personal care services. None of these were drastic drops and are presumably discretionary income. If 2001 can be used to predict spending patterns for 2005-2006, then employment should not be significantly affected in other sectors as a result of higher fuel prices. Also, this past winter was not as cold as winter 2000-2001. Expenditures for eating away from home, entertainment, and vehicle purchases actually increased in 2001, in spite of higher fuel prices and the recession. Since utilities are such a small portion of total annual expenditures, there should not be a big effect in other sectors. Even if utility prices do not level off or decline as they did in the latter half of 2001, the decreased spending will most likely be spread among several industries.
Wyoming total nonagricultural employment for 2001 increased 2.5% over 2000. The largest increases were in support activities for oil & gas (up 24.4%), oil & gas extraction (up 22.2%), Wholesale Trade (up 7.8%), Professional & Business Services (up 6.8%), Educational & Health Services (up 6.0%), and Construction (up 5.4%). Therefore, we expect employment in oil & gas extraction and support activities for oil & gas to continue to rise with the increased prices of energy.
In conclusion, the national data from the Consumer Expenditure Survey indicate little change in spending patterns of consumers when the price of heating fuels increases 40.0%. However, since Wyoming is an energy exporter, our employment figures should increase due to oil and gas activity which will have a spillover effect in Construction and other industries.
References
Bureau of Labor Statistics. (2003, April). Consumer Expenditures in 2001. Retrieved July 5, 2006, from http://www.stats.bls.gov/cex/#news
Bureau of Labor Statistics. (2005, October 14). Consumer price index: September 2005. News. In Archived news releases for consumer price index. Retrieved July 5, 2006, from http://www.stats.bls.gov/schedule/archives/cpi_nr.htm
Bureau of Labor Statistics. (2006, June 14). Consumer price index: May 2006. News. Retrieved July 5, 2006, from http://www.bls.gov/news.release/cpi.toc.htm
Energy Information Administration. (2005, December 6). Short-term energy outlook. Retrieved July 17, 2006, from http://www.eia.doe.gov/emeu/steo/pub/contents.html
Energy Information Administration. (2006, July 17). Short-term energy outlook. Retrieved July 7, 2006, from http://www.eia.doe.gov/emeu/steo/pub/contents.html
National Oceanic and Atmospheric Administration. (2001, March 13). December 2000 - February 2001 U.S. National Analysis. Retrieved July 17, 2006, from http://www.ncdc.noaa.gov/oa/climate/research/2001/win/us_national.html
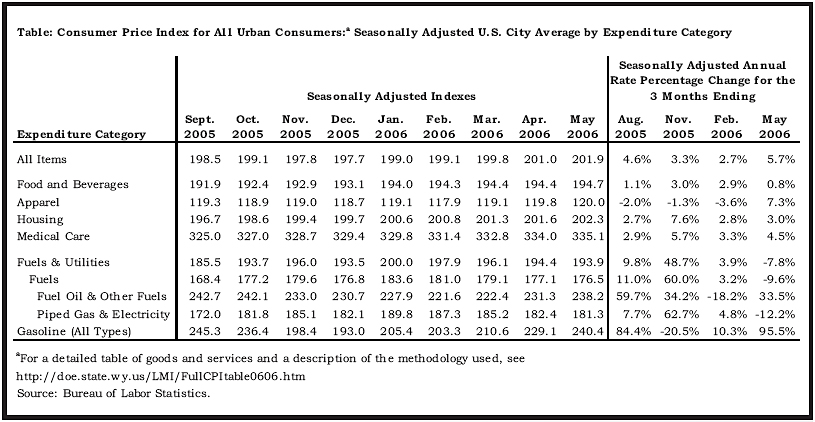
Table of Contents | Labor Market Information | Wyoming
Job Network | Send Us Mail
Last modified on
by Phil Ellsworth.