© Copyright 2006 by the Wyoming Department of Employment, Research & Planning
Vol. 43 No. 5
An update of tables showing annual earnings by age and gender in Wyoming reveals two trends: The number of workers for whom demographics are unknown continues to rise, as does the number of workers in the 55- to 64-year-old age group. A lack of demographic information often indicates nonresident status, and an increase in the 55 to 64 age group shows Wyoming’s work force is aging.
Research & Planning (R&P) recently updated a series of tables on the Wyoming Labor Market Information website. These updated tables show annual earnings in Wyoming by age and gender for the years 2003 through 2005. Earnings figures and industry classifications are based on Unemployment Insurance (UI) Wage Records and represent a count of individuals who worked in Wyoming at any time during the year. Each person is represented one time, regardless of the number of jobs he or she worked.
One of the surprising pieces of information on the tables is the increasing number of workers in each industry for which we have no demographic information in any of our administrative databases (Driver’s License, Unemployment Insurance claims, etc). As is shown in Figure 1, the number of people for whom demographics are unknown has increased dramatically from 1994 to 2005. In 1994 only 7.5% of the total work force lacked known demographics. By 2005 this number increased to 18.8%. The increases were highest in the Construction and Leisure & Hospitality industries. The absence of demographics is most often associated with a nonresident status (Jones, 2002; 2004). Residency determination will be made in July and summary statistics published subsequently.
Another interesting note is the increase in the number of workers age 55 to 64 (see Figure 2). In 1994, 6.8% of the work force was in this age range. The percentage rose to 10.3% (or 5,713 people) in 2005. This increase is further evidence Wyoming’s workforce is aging.
The aging phenomenon is most apparent in Educational Services. Figure 3 and Figure 4 show the 2005 distribution of Wyoming workers in the state as a whole and in Educational Services, respectively. Statewide, 40.2% of working women and 39.6% of working men were over age 45. In Educational Services however, 55.0% of women and 52.0% of men were over age 45. If surrounding states are experiencing the same demographic shifts as Wyoming, our high school and college systems may see increasing pressure to educate more qualified teachers over the next 10-15 years. The Table uses R&P’s staffing patterns (available at http://doe.state.wy.us/LMI/staffingpatterns2003/staffingpatterns2003.htm) to examine the distribution of employment in Educational Services. From it we can ascertain that most of the 5,713 reaching retirement age are teachers and administrators. In 2002, only 113 individuals graduated from a Wyoming community college with an education degree (Saulcy, 2004). While data from the University of Wyoming are unavailable, the state may lack enough graduates available to fill upcoming shortages caused by retirement.
All of the industries and years discussed in this article can be accessed on our website at http://doe.state.wy.us/LMI/wfdemog/toc3.htm.
References
Jones, S. D. (2004). Worker residency determination, Wyoming stepwise procedure. Wyoming Labor Force Trends 41(8). Retrieved June 5, 2006, from http://doe.state.wy.us/LMI/0804/a1supp.htm
Jones, S. D. (2002) Defining residency for the Wyoming workforce. Wyoming Labor Force Trends 39(11). Retrieved July 26, 2004, from http://doe.state.wy.us/LMI/1102/a1.htm
Saulcy, S. (2004). Where are they now? Wyoming community college graduates’ labor market outcomes 2004. Retrieved June 5, 2006, from http://doe.state.wy.us/LMI/CollegeReport2004.pdf
Return to text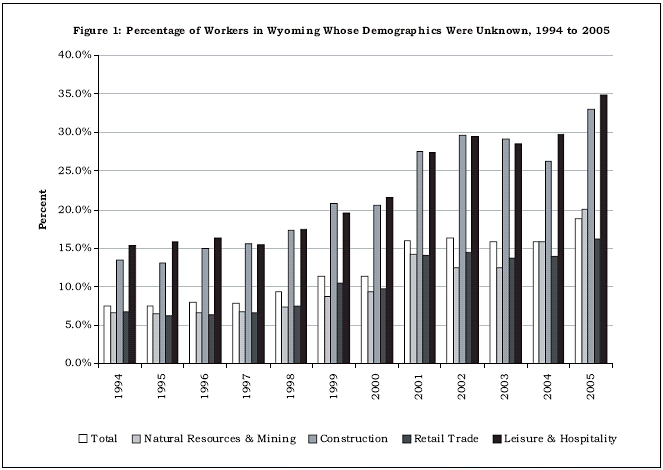
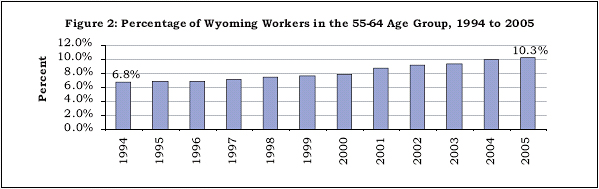
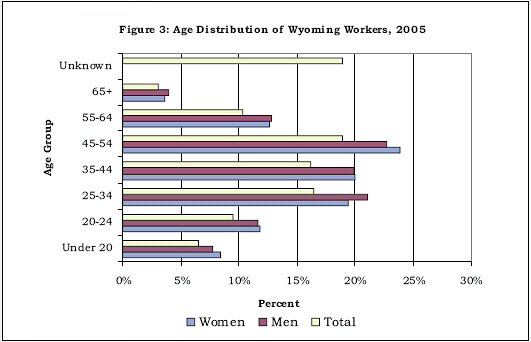
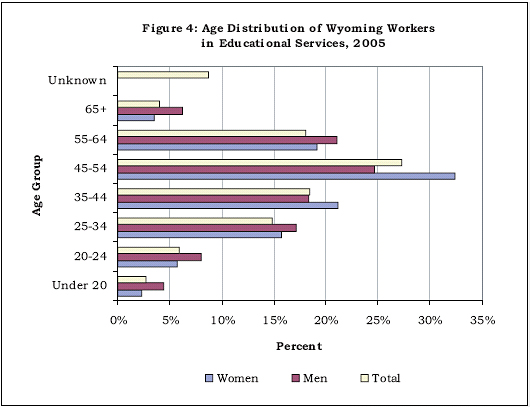
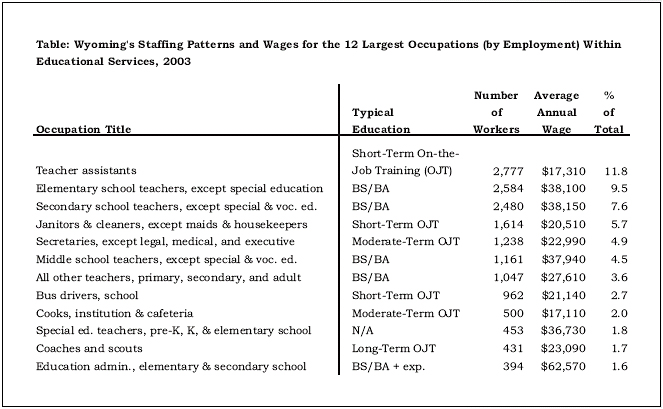
Table of Contents | Labor Market Information | Wyoming
Job Network | Send Us Mail
Last modified on
by Phil Ellsworth.