© Copyright 2007 by the Wyoming Department of Employment, Research & Planning
Vol. 44 No. 3
A comparison of short-term Wyoming employment projections developed in 2004 for second quarter 2006 reveals that the total absolute percentage error between projected and actual values was 5.7% at the statewide level. Comparisons to prior projections show that errors increased slightly when compared to prior forecasts. However, the amount of increased error was not appreciable. Bias statistics indicated that, on average, forecasts were generally less than actual employment values, but this was not universally true across all industries.
The ability to develop accurate employment projections is critical to understanding future developments in Wyoming’s labor market. As a follow-up to an earlier article (Leonard, 2004), we again compare the projections developed in second quarter 2004 (2004Q2) which forecasted employment in second quarter 2006 (2006Q2). As in the previous report, the data source for this analysis was the Quarterly Census of Employment and Wages (QCEW; U.S. Department of Labor, 2006). QCEW data are compiled from Unemployment Insurance (UI) tax reports submitted by employers on a quarterly basis. QCEW data represent approximately 95% of all jobs worked in Wyoming exclusive of the self-employed, unpaid family workers, some federal government workers, some agricultural workers, and most railroad employees (Leonard, 2004).
Methodology
Two methods were used to evaluate projections accuracy in 2006Q2, absolute percentage error and bias (see Leonard, 2004 for definitions). One change from the prior set of projections is that the current data set was compiled using North American Standard Industrial Classification System (NAICS) codes, whereas prior projections used Standard Industrial Classification (SIC) codes. All projections performed in 2004Q2 were produced at the subsector (3-digit NAICS) level. For comparison purposes, forecast accuracy was evaluated at both the 3-digit and sector levels (groupings of 3-digit industries). These groupings are used to not only analyze projections accuracy but also to examine how the distribution of jobs changed both in Wyoming and nationally during the forecast period.
Findings
Table 1 presents forecast accuracy data at the 3-digit NAICS level. For the purposes of this analysis, we chose to analyze industries with employment of 4,000 or greater in 2004Q2 to avoid data disclosure issues. The results show that the absolute percentage error for the 22 specified industries was 5.5%. This level is slightly greater than the 4.38% absolute percentage error for 17 SIC industries presented in 2004. Absolute error for the remaining 69 NAICS industries was 6.2%, and the total absolute percentage error statewide was 5.7% (compared to 5.0% in 2004). The total error at the statewide level was 1.7% ((268,710/264,171)-1). This number is slightly greater than the 1.1% error achieved in 2004.
The causes of increased forecast error are varied. Some error is due to the fact that more subsectors were projected, which increases the chance of error. Another type of error occurs when employers incorrectly report their employment counts. In light of these factors, perhaps the most prevalent source of error was our comparatively low forecasts of employment growth in Mining and Construction. Our forecast errors were in excess of 9.0% in five subsectors as shown in Table 1 (NAICS 212, 213, 236, 237, and 238). In early 2005, when these forecasts were prepared, the full extent of the current economic expansion was underestimated, leading to forecast error.
The types of errors described in Table 1 are also shown in Table 2. Table 2 illustrates forecast error levels when evaluated at the sector level. The greatest errors are shown in the supersector of Natural Resources & Mining (NAICS 21 and 11; 11.8%) and the Construction sector (11.0%). Other sectors such as Retail Trade (1.0%), Financial Activities (0.8%), and Leisure & Hospitality (1.2%) had actual results very similar to projected values.
The conservative nature of our prior forecasts is illustrated in Table 3. The bias statistic shows our forecasting tendencies in 2004. Table 3 shows that whether analyzing the largest 22 industries, the remaining 69 industries, or sectors, we tended to generate predicted values which were less than the actual values. For the 22 largest industries, Research & Planning forecast values were an average of 114.8 jobs less than the actual values, and 349.1 jobs less than actual values at the sector level.
Another way to use employment data is to compare the proportions of jobs in the workforce by sector, as shown in Table 4. Wyoming’s proportion of sector employment was greater than national proportions in seven of 13 sectors in 2004Q2 and greater than national proportions in eight sectors in 2006Q2. The greatest differences between state and national proportions (2006Q2) occurred in Mining (-8.2%), Manufacturing (7.1%), and Professional & Business Services (7.0%). State employment proportions were closest to national proportions in Education & Health Care (-0.1%), Retail Trade (-0.2%), and Miscellaneous Services (0.3%). Although Wyoming’s employment distribution differs considerably from the national distribution, it may insulate the state from some of the economic shocks experienced on a national level, and maintains wages at a higher level than might otherwise be possible (Harris, 2002).
Implications
As stated in the 2004 article, projections are subject to considerable error due to fluctuations in data values, unforeseen events and analyst choices. Although forecast errors were comparable during the two iterations studied, they increased slightly for the more recent forecasts. This could be in part due to the switch from SIC to NAICS whereby 91 industries are forecasted at the statewide level instead of 75. In addition, the more rapid than expected economic expansion contributed substantially to the overall forecast error. It is reasonable to assume that during times of rapid expansion or contraction it is more difficult to accurately forecast employment. However, the differences in error rates did not increase appreciably compared to the prior round of forecasts given the magnitude of the current expansion.
References
Harris, M. (2002). Is Wyoming’s economy diversifying and is economic diversity in Wyoming desirable? Wyoming Labor Force Trends, 39(9). Retrieved March 8, 2007, from http://doe.state.wy.us/lmi/0902/0902.pdf
Leonard, D. (2004). An examination of short-term employment projections accuracy. Wyoming Labor Force Trends, 41(5). Retrieved March 8, 2007, from http://doe.state.wy.us/lmi/0504/0504.pdf
U.S. Department of Labor, Bueau of Labor Statistics. (n.d.). Quarterly Census of Employment and Wages. Retrieved March 8, 2007, from http://www.bls.gov/cew.home.htm
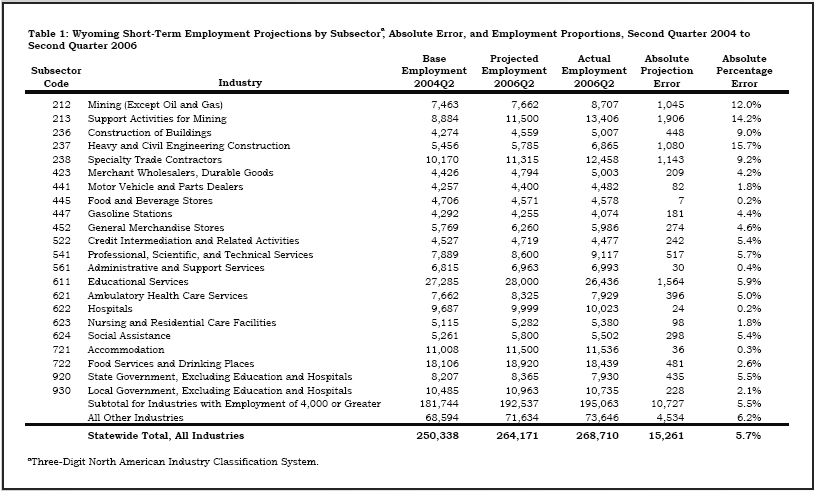
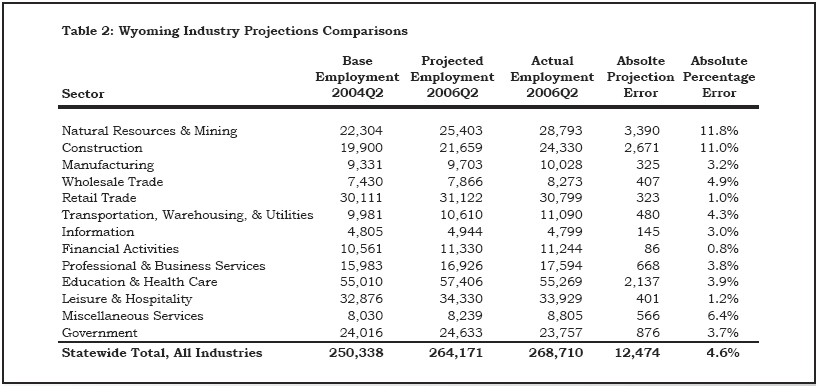
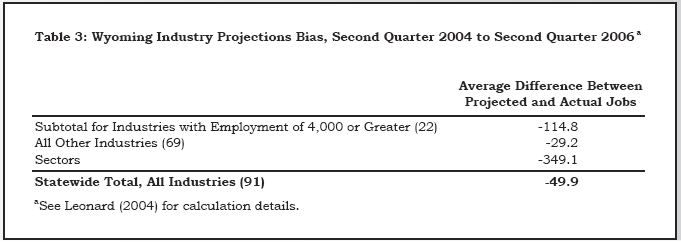
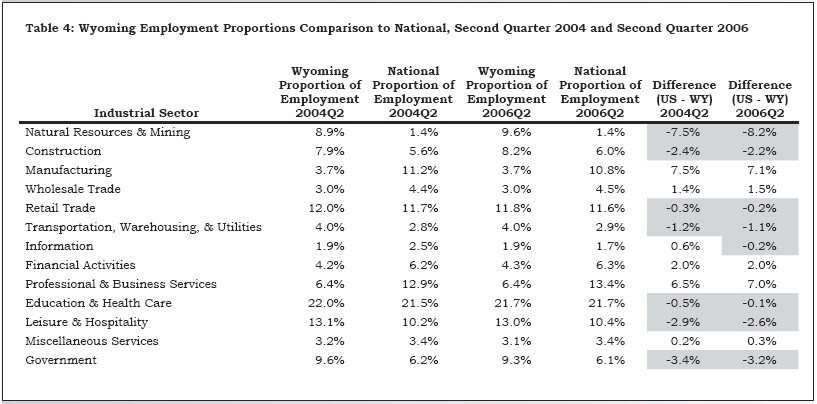
Table of Contents | Labor Market Information | Wyoming
at Work | Send Us Mail
Last modified on
by Phil Ellsworth.