© Copyright 2006 by the Wyoming Department of Employment, Research & Planning
Vol. 43 No. 3
The Central States Compensation Association (CSCA) survey data compare occupational wages in Wyoming state government to the same occupation’s average in other participating states. CSCA data, however, do not allow wage comparisons between state employees and individuals employed in the same occupations within Wyoming. In this study, we compared Wyoming state employees to Occupational Employment Statistics (OES) data for Wyoming to determine whether underpayment relative to the local market may contribute to employees leaving state government. Results indicate underpaid state employees account for a higher percentage of turnover than do those paid above market.
Use of the Central States Compensation Association (CSCA) survey data provides a means of comparing an occupational wage in Wyoming state government to the same occupation’s average in other participating states (“Central States,” n.d.). The CSCA data provide a useful market evaluation tool for state administrators and legislators.
CSCA data, however, do not allow comparison of state employees to individuals employed in the same occupations in different industries within Wyoming. State employees work in a local market and knowing how their wages compare to those of the local market may also be important. For example, an accountant’s wages may compare favorably to other accountants in the CSCA, but they may be low compared to the average paid to accountants in Wyoming. In this situation, Wyoming would appear to have minimal risk of losing this accountant to other state governments in the CSCA but may have substantial risk of turnover to private entities within the local market.
In this study, we compared the 2003 cohort of Wyoming state employees to 2003 Bureau of Labor Statistics (BLS) Occupational Employment Statistics (OES) data for Wyoming (for the most current data see http://doe.state.wy.us/ANSWERS/). OES data serve as the premier data source for Wyoming occupational wages. Specifically, we compared wage rates for employees who left state government employment in 2003 to the OES market pay range for their occupation. The purpose of this study is to determine whether underpayment relative to the local market may contribute to employees leaving state government. The study also aims to determine wage differences between 2003 and 2004.
Data and Methods
The 2003 state employee file was provided to Research & Planning (R&P) by the Wyoming State Auditor’s Office. The data include the social security number (SSN) and job title of each state employee who worked at any time during 2003. Confidentiality requirements do not permit disclosure of individuals’ identities. Wage data come from the Wyoming Wage Records database. It contains the SSN, quarterly wages, and Unemployment Insurance (UI) employer account number. Employer ownership codes (e.g., state, local, private) were obtained from the BLS Quarterly Census of Employment and Wages (QCEW). Gender and birth date of state employees were obtained from the Wyoming Department of Transportation Driver’s License database. These separate data files were combined into a working file. Figure 1 shows the data sources used to create the working file. Variables shown within the arrows indicate the match key for merging data into the working file.
State job titles included in the working file were converted to associated six-digit Standard Occupational Classification (SOC) codes by the Wyoming analyst responsible for the OES program (Hauf & Cowan, 2005). As an example of the conversion, the state job title FS01A Financial/ Statistical Specialist 1 corresponds to SOC 13-2011 Accountants and Auditors. A full listing of the job titles and their SOC match is posted on our website at http://doe.state.wy.us/LMI/0306/TableA1.htm.
Of the 10,939 persons appearing on the state payroll, 8,638 were assigned a valid SOC code. Those without an SOC code (2,301) were excluded from the comparative analysis presented here. They include 795 at-will contract employees (AWEC), 730 special classified employees (TP01) who do not carry a specific state job title, 69 employees with a state job title lacking the track designation (FS01A Accountants and Auditors compared to FS01D Economists) necessary to convert to SOC, and 7 miscellaneous employees. Those without an SOC code also include 700 members of boards, commissions, the legislature (including session staff), and the judiciary.
Total wages in 2003 were calculated for each SOC code using Wage Records data (see Table). Wages were then adjusted downward to eliminate longevities paid in 2003 ($40 per month for each 60 months worked) and the estimated overtime paid in 2003 (overtime paid in 2004 adjusted to 2003 dollars using the Consumer Price Index for All Urban Consumers [CPI-U]). This procedure brings wages reported in Wage Records into parity with wages reported in the OES survey. OES captures the base rate of pay only and does not include longevity or overtime. The reasonableness of this procedure was examined. For occupations where state employees make up all of the employment in the state, the average wage (as calculated from wage records) is nearly identical to the OES estimate.
OES data came from the semiannual (May and November) 2003 collection from state personnel. Data provide an estimate of Wyoming total employment by occupation, the average wage, and relative standard error for the average wage. A 95% confidence interval was calculated for the OES average wage for each occupation. This highly-reliable interval was used as the market pay range.
The wage record average hourly wage for state employee SOC codes were sorted into those that fell below, within, and above the OES market pay range. Theoretically, state employees who fall below the range are underpaid relative to the local market, those within the range are being paid at market, and those above the range are being paid better than market.
Turnover categories utilized in this analysis were adapted from Glover (2001). In this case, a turnover transaction is defined as an entry or exit (or both) between state government and either local government or the private sector with respect to the reference quarter, the quarter before, and the subsequent quarter. Turnover can be calculated at the employer, ownership (state government, local government, or the private sector), or market levels (job changing between states). Continuous employment is defined as three consecutive quarters of employment (i.e., the reference quarter and the prior and subsequent quarters) within the same ownership. Past turnover studies conducted by R&P reflect turnover between firms rather than between ownerships (Glover & Leonard, 2003). For this methodology, state employees can change jobs within state government without the change counting as a turnover transaction (e.g., employment in the Wyoming Department of Health followed by a job change to the Wyoming Department of Family Services). Theoretically, changing jobs between state agencies does not represent a loss of skill and talent to the state. Changing to the private sector or local government does.
Results
Figure 2 shows the percentage of average quarterly turnover transactions during 2004 among the cohort of 2003 state employees by market pay range. State employees who are underpaid relative to the local market account for a higher percentage (55.4%) of turnover transactions. The percentage is higher for women than men by about seven percentage points. Those paid above market account for the smallest percentage of turnover transactions (15.7%). Of those experiencing turnover from state government, a higher percentage of men than women fall within and above the market pay range for their occupation.
Figure 3 shows the wage increase between 2003 and 2004 for the 2003 cohort of state employees who left state government. Turnover employees who were below market for their occupation experienced the largest percentage increase in wages between 2003 and 2004 (7.9%). Those within market experienced a small increase, while those above experienced a decrease in wages. Exploring differences by gender reveals that women earning below the market pay range for their occupation experienced a much larger percentage increase between 2003 and 2004 than did men (9.7% compared to 5.0%). Men who were earning within and above market and who left state government in 2003 experienced a decrease in wages in 2004. Additional analysis not reported here indicates that a higher percentage of males than females who left state government in 2003 were older. Some may have retired from the state and taken post-retirement jobs that pay substantially less. Official retirement status was not explored in this analysis.
Discussion
A portion of those paid at or above the local market exited state government. Wages are not the only contributing factor to turnover; however, over half of those who left state government employment were paid below market. If we can generalize from these results, bringing underpaid occupations into parity with the local market rates may reduce the likelihood that individuals will leave state government.
An examination of gender differences reveals not only are underpaid women a higher percentage of those who exit, but when they leave state government they experience a larger increase in pay than do men. Well-paid, highly educated women employed in Wyoming state government may have fewer alternatives outside state government than do men. Bringing underpaid state employees into parity with the market may reduce turnover—particularly for women. It should be noted that this study reviews wages prior to state employee equity adjustments implemented in 2004, and continuing in 2005 and 2006. These equity adjustments have targeted employees earning below their competitive market range, and as a matter of gender, have been particularly beneficial to women who are more likely to fill these jobs. In the future, R&P could examine the effect of the equity adjustments.
Conclusion
This study demonstrates that an examination of state employees relative to the local market provides useful information about state employee turnover and pay. A regional state government comparison of occupations such as that provided by the CSCA, although important, cannot illuminate the local economic context in which state employees work. Only by explicitly examining local context and its consequences can these questions be addressed. Consequently, we conclude that individuals paid less than a competitive market wage are more likely to exit state government to earn higher wages elsewhere.
References
Central States Compensation Association overview. (n.d.). Retrieved March 8, 2006, from http//personnel.state.wy.us/ SEEC/CSCA.pdf
Glover, W. (2001). Turnover analysis: Definitions, process, and quantification. Retrieved March 7, 2006, from http:/ /doe.state.wy.us/LMI/w_r_research/Turnover_Methodology.pdf
Glover W. & Leonard, D. (2003). Your employee turnover: How to calculate it and how it compares. Wyoming Labor Force Trends, 40(12), 1-6.
Hauf, D. & Cowan, C. (2005). Wyoming wage survey. Retrieved March 6, 2006, from http://doe.state.wy.us/LMI/ OESBen2004.pdf
Wyoming Employment Security Law, Wyo. Stat. Ann. §§ 27-3-603 (2003).
Return to text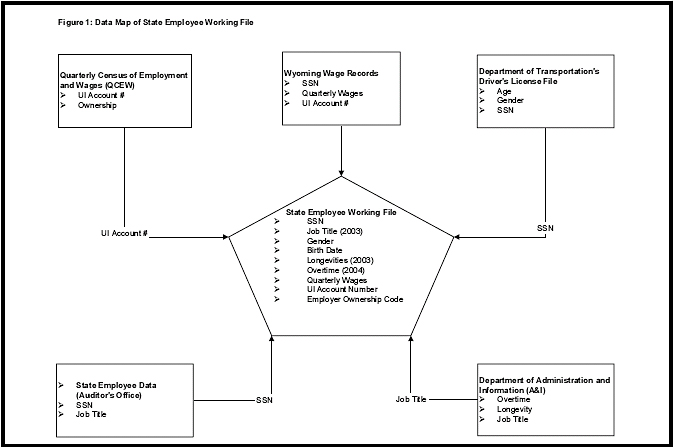

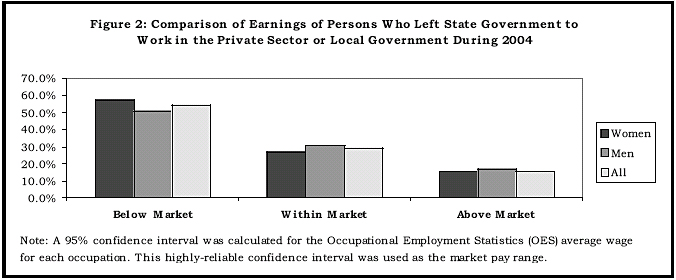
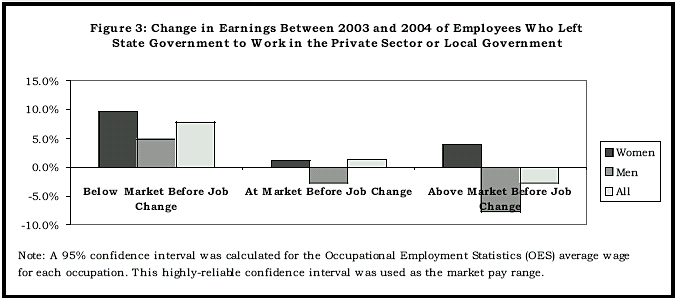
Table of Contents | Labor Market Information | Wyoming Job Network | Send Us Mail
These pages designed by Julie Barnish.
Last modified on
by Phil Ellsworth.