© Copyright 2007 by the Wyoming Department of Employment, Research & Planning
Vol. 44 No. 2
Although recent energy price increases have benefited the state, the same cannot be said for other states. For example, the American auto industry’s financial challenges have been magnified by an over-reliance on the sales of relatively high fuel consuming pickups and sport utility vehicles (SUVs). Sustained high energy prices will not only negatively impact light vehicle sales, but potentially the fiscal health of both Wyoming and the nation.
Will the current oil and gas boom last multiple decades? While such a scenario is possible, one issue routinely dismissed in optimistic predictions are the negative effects of high energy prices. These include increased consumer prices nationally and stunted national economic growth in light of current and future federal financial obligations (Walker, 2006). Forecasts produced by the Energy Information Administration indicate that for each $10 per barrel increase in the price of crude oil, the Gross Domestic Product (GDP) of the United States declines by approximately 0.2% within the first 12 months. If prices remain at elevated levels the second year, GDP is projected to decline another 0.5% (EIA, 2006). Corresponding to crude oil prices are projections that unemployment rates increase by 0.1% in the first year and 0.2% in the second year (EIA, 2006).
Tangible Effects Observed
Some of the negative effects of high energy prices on the national economy can already be seen in recent automobile unit sales data (Ward’s Automotive Group, 2006). In particular, sales of light trucks and SUVs are substantially lower for the first eight months of 2006 compared to the same period in 2005. Overall national light vehicle sales declined by 4.4% compared to the same period in 2005.
According to Ward’s sales data, overall light vehicle sales for the Big 3 U.S. automakers (Ford, General Motors, and Chrysler) were 11.0% lower in 2006 than in 2005. The company with the largest unit sales losses was General Motors which realized an over-the-year loss of 12.2%. In contrast, Japanese automaker Toyota realized a unit sales gain of 11.0% for the same period. European car manufacturers posted a gain of 9.0% compared to last year.
Although unit sales declined for the Big 3 in aggregate, it is interesting to note in which market segments over-the-year sales declines were most acute. Figure 1 illustrates the relative market shares of different vehicle types for the first eight months of 2005 and 2006. In comparing the two charts, we see that market shares for all types of cars and CUVs (e.g., cross/utility vehicles like Chrysler’s PT Cruiser and the Subaru Forester) increased or remained constant, while market shares declined for pickups (19.5% in 2005 compared to 17.2% in 2006) and SUVs (14.5% in 2005 compared to 12.4% in 2006). Figure 2 shows a side-by-side comparison of light vehicle unit sales by market segment. Although the data show the same trends as in Figure 1, we see that unit sales for luxury cars declined even though the market share for these vehicles remained constant. Table 1 shows examples of vehicles for each market segment.
The decline in units sold and market share for larger vehicles made by Chrysler, is symptomatic of “…a glut of unsold trucks and SUVs such as the Dodge Durango” (Krolicki, 2006). Such declines prompted DaimlerChrysler to search for partners in the world market with which to manufacture more fuel-efficient subcompact cars, including Chinese companies (Krolicki, 2006). Ford experienced large vehicle sales declines similar to Chrysler. Ford’s sales declines coupled with significant health care and retirement liabilities prompted the company to announce the elimination of as much as one-third of its workforce (Gupta, 2006).
Some of the effects of high crude oil and fuel prices can also be seen in the sales data for more fuel efficient hybrid vehicles. Unit sales of hybrid vehicles increased 24.8% in January-August 2006 compared to the same period last year. The bulk of the increase was due to the introduction of Toyota’s hybrid truck, the Highlander. Sales of the Highlander Hybrid increased from 8,358 units in January-August 2005 to 23,474 units in January-August 2006. Toyota and Honda dominate the hybrid vehicle market, holding a 90.7% unit market share for year-to-date sales in August 2006. However, recent Big 3 hybrid truck introductions have captured some market share. The absence of the Big 3 from this market appears to have contributed to their financial difficulties as well.
Conclusions
While historically high energy prices are beneficial to Wyoming’s fiscal health, the same cannot be said for that of the United States. High energy prices tend to retard macroeconomic growth, increase trade deficits, and can place the overall financial health of the country in jeopardy. It is reasonable to assume that if traditional fossil fuel energy prices become exorbitant enough (or if national security concerns arise), a revolutionary energy source could displace existing energy sources. New energy source propagation could then lead to long-term reductions in fossil fuel consumption thereby eroding the state’s income base. If consumers trade larger vehicles for smaller ones en masse or utilize public transportation more fully, additional erosion could take place. Whether or not these things will happen depends upon the level of tolerance our nation has relative to energy prices and supplies.
References
Gupta, P. (2006). Ford to cut one-third of work force. Reuters Canada News Service. Downloaded September 20, 2006, from http://ca.today.reuters.com/news/newsArticle.aspx?type=businessNews&storyID=2006-09-15T172611Z_01_WEN5468_RTRIDST_0_BUSINESS-AUTOS-FORD-COL.XML
Krolicki, K. (2006). Chrysler may turn to China for small car. Reuters News Service. Downloaded September 25, 2006, from http://today.reuters.com/news/articlebusiness.aspx?type=ousiv&storyID=2006-09-25T171917Z_01_N25262373_RTRIDST_0_BUSINESSPRO-AUTOS-CHRYSLER-DC.XML&from=business
United States Department of Energy, Energy Information Administration. (2006). Annual Energy Outlook 2006: With Projections to 2030. Downloaded September 20, 2006, from http://www.eia.doe.gov/oiaf/aeo/pdf/0383(2006).pdf
Walker, D. (2006). Saving our future requires tough choices today. United States Government Accountability Office. Downloaded September 25, 2006, from http://www.gao.gov/cghome/d061084cg.pdf
Ward’s Automotive Group (WardsAuto.com). (2006). US Light Vehicle Sales. Unpublished data. Received September 20, 2006. Used with permission from Ward’s Automotive Group.

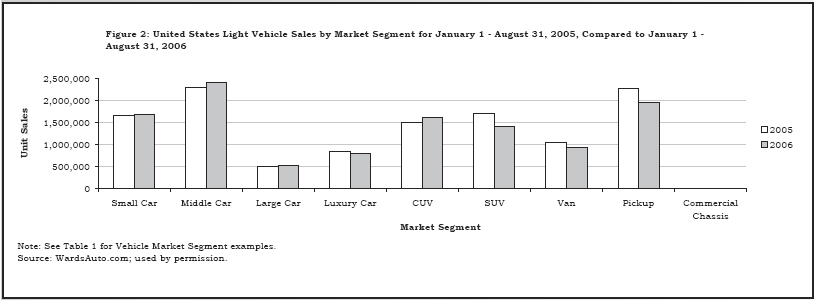
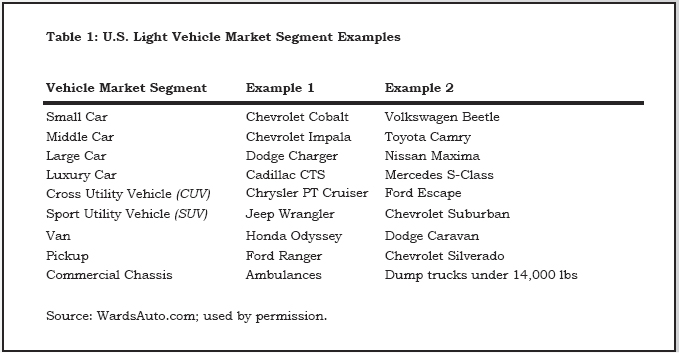
Table of Contents | Labor Market Information | Wyoming
at Work | Send Us Mail
Last modified on
by Phil Ellsworth.